11
$\begingroup$

Say I have a dataset that shows me the number of times per day someone has used a mobile app that I have developed. And that dataset (after sorting) looks like this:

[2, 3, 3, 3, 3, 4, 4, 4, 4, 4, 5, 5, 5, 7, 12, 15, 15, 15, 15, 15, 15]

I want to return a number that I would bet is the number of times the user is going to use my app tomorrow or awfully close to it. (Assume that I don't care about the order that these numbers were originally reported in the past 21 days. I only want to predict and return a number based on magnitude alone.)

As a human analyst looking at this dataset, I would bet on the number 4. The reason is not only are there a lot of natural occurrences of 4 but there are a lot of numbers that are awfully close to 4.

Is there a measure or existing algorithm that will return 4 from the above dataset?

Things I've tried:

The mode of this dataset is 15. While this is interesting to note, I consider 15 to be an outlier in this set, as there are more values closer to 4 than 15.

The mean of this dataset is 7.5. We are getting closer to 4, but the value closest to the mean - 7 - only occurs once.

The median of this dataset is 5. Getting really close now, but still not what I want since there are only a few occurrences of 5.

The first quartile is 3.5. This would be close enough, but I think it is luck that this happens to be close to the number I want. I feel like with a differently distributed dataset the first quartile might be off.

I am a statistics novice, so there might be concepts regarding how to break down this problem that I am not yet familiar with.

$\endgroup$
5
  • 2
    $\begingroup$ "Closest" in what sense? In statistics we normally talk about closeness in the sense of the squared error, (y_observed - y_predicted)^2. Then we consider all the possibilities and the probabilities of those happening to find the mean squared error, and we try to find the estimate that minimizes that error. But from your description it sounds like you have a different idea, since you rejected "5" and "7.5" because those exact values didn't happen very often. $\endgroup$ Commented Jun 29, 2021 at 17:27
  • 2
    $\begingroup$ $15$ is not really an outlier. While some people define the term "outlier" differently, one common way to find outliers is the $75\%+1.5\text{IQR}$ rule, which in your case is $31.5,$ well above your maximum. I would say that what you really have is a bimodal distribution. One way to look at your problem is to find the modes ($4$ occurs almost as often as $15$), and then see which mode is "closest" (you have to define that term) to the median. Finding the modes in the first place might work well with a peak detection algorithm. $\endgroup$ Commented Jun 29, 2021 at 17:36
  • 2
    $\begingroup$ If you consider the mode of your dataset an outlier, then your data is not clean enough. You will have to manually clean it first. $\endgroup$
    – Vincent
    Commented Jun 30, 2021 at 6:45
  • 1
    $\begingroup$ @AdrianKeister Based on your comment and answer, I think you got what I was actually looking for even if I didn't articulate my question perfectly. Upon reflection, I do believe I am actually looking for a mode, within a multimodal distribution, that meets certain criteria. Now I am trying to decide if that warrants a separate question. $\endgroup$ Commented Jul 1, 2021 at 17:20
  • $\begingroup$ Well, I'm happy to try to improve my answer if it's not quite what you were seeking. $\endgroup$ Commented Jul 1, 2021 at 18:04

3 Answers 3

20
$\begingroup$

To make this amenable to a rigorous analysis, you will need to specify a loss function. How bad is it to predict $x$ and obtain $y$, compared to a prediction of $z$? Once you have specified such a loss function, you can do a number of things. You may be able to find the value $x$ that minimizes your expected loss by simulation. For some loss functions, the minimizer is known.

I want to return a number that I would bet is the number of times the user is going to use my app tomorrow or awfully close to it

This to me sounds very much like you want to minimize the expected Mean Absolute Error (MAE),

$$ \text{argmin}_x E_y|x-y|, $$

where we assume that $y$ follows the distribution you have observed in your dataset.

If we can agree that the expected MAE is what you want to minimize, you are in luck, because it is known which quantity will do so, namely the median: Why does minimizing the MAE lead to forecasting the median and not the mean?

As you observed, the median here is $5$, not $4$, although there are more $4$s than $5$s in your dataset. The reason for this is that all the $15$s "pull" the argmin up - the chance of observing a $15$ means that predicting a $5$ is less costly than predicting a $4$.

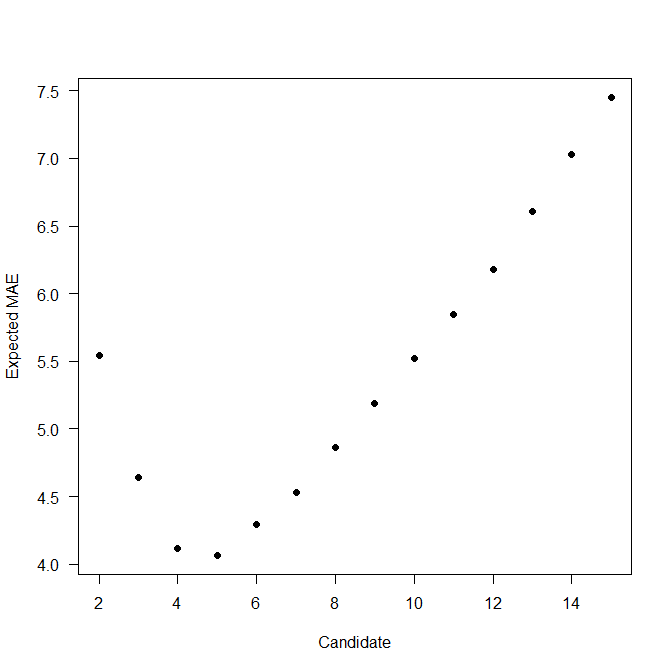
We can run a very simple simulation of the expected MAE by resampling from your dataset and evaluating the MAE for various candidate predictions. (Actually, for a dataset that is as simple as yours, there is really no need to simulate, you can just tabulate.) In R:

dataset <- c(2, 3, 3, 3, 3, 4, 4, 4, 4, 4, 5, 5, 5, 7, 12, 15, 15, 15, 15, 15, 15)
set.seed(1) # for reproducibility
sims <- sample(dataset,size=1e5,replace=TRUE)

candidates <- seq(min(dataset),max(dataset))
emae <- sapply(candidates,function(xx)mean(abs(sims-xx)))
plot(candidates,emae,pch=19,xlab="Candidate",ylab="Expected MAE",las=1)

EMAE

As you see, $5$ will lead to a slightly lower expected MAE than $4$.

Now, if this is not what makes you happy, then we need to find out what does make you happy... that is, we need to choose a different loss function. Once you do so, you can run a similar simulation and pick the minimizer. If you have tweaked your loss function just right, the minimizer will the $4$. (But of course, it makes more sense to think about what loss function makes more sense, rather than start with your desired outcome.)

Alternatively, perhaps your loss is better described by the squared distance $(x-y)^2$ between the prediction $x$ and the outcome $y$. If so, the minimizer would be the mean of your dataset (that the mean minimizes squared distances is a standard result in statistics) - as you observe, that is $7.5$.

$\endgroup$
4
$\begingroup$

Here's the algorithm I would run:

  1. Find peaks in the histogram. The data here is $$[0,0,1,4,5,3,0,1,0,0,0,0,1,6],$$ so that the index into the array corresponds to the original data. That is, there are no $0$'s or $1$'s, there is one $2,$ four $3$'s, and so on. Any peak detection algorithm you would have to tweak, particularly with its window size (how many data points does the detector use at a time?). I would expect in this situation to find two peaks: $4$ and $15.$ Caveat: if your peak detector needs a bi-directional tapering off from the peak, then it might not find $15$ as a peak - that won't hurt in this particular scenario. If you need integer values, make sure to round the result, as a peak detector won't necessarily give you integer output.
  2. Find the median, which is $5.$
  3. Choose the peak in the first step that is closest (as in, the distance function $d(x,y)=|x-y|$) to the median, which would be $4.$

This strikes me as a reasonable way to get at what you want.

$\endgroup$
0
$\begingroup$

I would use the median, because it should be at or near the most likely number of times the next random user would use your app. Even if there are few occurrences of it in your data now, if you're looking at a random user in the future, then it would be closest.

If you want to know how many times the app will likely be used (across all users, not just the next single random user), then the mean would be appropriate. That would give you the average number of usages of the app by all users.

You have a wide range of users' usages of the app, with several at 15. If possible, you could do a regression to predict how many times the app will be used by what kind of user. But you would have to have knowledge of the users, such as gender, age, time of day or other things AND these would have to be viable predictors of app usage in a regression model of your data in order for you to use it to predict future usage.

If you were a betting man and wanted to bet on the most likely number of times the app would be used, you should use the mode of 15---but be aware that most users would not use it 15 times and you would be wrong most of the time, although less wrong than choosing any other single number. If you choose the median of 5, then 5 and it's nearest neighbors of 4 and 7 would collectively occur 9 times and be more likely than 15, which only occurred 6 times.

So it really depends on what your goal is: predicting what the next single user will do approximately, or taking a gamble on the most likely precise number of usages the next single user will do, or predicting the number of usages across all users. You can predict how many times the next single user will use the app appoximately by using the median; or take a gamble on a precise number and go with the mode, but knowing this gamble would be wrong 5 out of 21 times (or 72% of the time). For the predicted average number of usages (across all users) you would use the mean. Of course, all of this is based on your particular data distribution which you provided. With ideal data (which yours isn't), the mean, median and mode would all be the same in a bell-shaped normal distribution and that number would be the one to use.

Some of the above answers suggest finding the number you want by incorporating a PREDICTED number in a formula---but you need to find this predicted number in the first place, which is the crux of your question!

$\endgroup$

Your Answer

By clicking “Post Your Answer”, you agree to our terms of service and acknowledge you have read our privacy policy.

Not the answer you're looking for? Browse other questions tagged or ask your own question.