1
$\begingroup$

I'm doing some work in which the two-sample Kolmogorov-Smirnov test statistic

$$KS^x_{n_1, n_2} = \sup_x | F_{1,n_1}(x) - F_{2, n_2}(x) |$$

takes on a specific economic meaning. I have computed these test statistics for two variables on two sub-samples of my data and would now like to know whether the difference of KS statistics across the two variables is significant. That is, in addition to the test statistic just mentioned I also have

$$KS^y_{n_1, n_2} = \sup_y | F_{1,n_1}(y) - F_{2, n_2}(y) |$$

where $y$ is comparable in interpretation to $x$ and I want to do a hypothesis test of the type

\begin{align} H_0 &: KS^x - KS^y = 0 \\ H_1 &: KS^x - KS^y \neq 0. \end{align}

For the regular two-sample one-variable KS test, the critical value is given by

$$\overline{KS} = \sqrt{- \ln\left(\frac{\alpha}{2}\right) \times \frac{1+\frac{n_2}{n_1}}{2 n_2}}.$$

I don't yet see a way of deriving a critical value for the difference test I'm trying to do.

Optional details on the above-mentioned economic interpretation

In my application, the KS statistic captures the difference in distribution between returns preceding sell orders and the returns preceding buy orders on an investment portfolio. The economic interpretation is that it measures the extent to which people respond to realized returns (“reactivity”) in ways that are consistent with trying to time the market. The intuition behind this interpretation is that buying and selling that is not reactive to the market and instead based only on household liquidity, would amount to returns before buys and returns before sells both being random samples from the return distribution. The KS test would then not reject the null of identical distributions. (A simple way to think about household liquidity is the idea that people buy the portfolio from excess cash when they inherit money; they sell the portfolio if they want to buy a car. These things would not have any obvious relationship with market returns.)

With the interpretation that the KS test statistic measures investor reactivity to market returns in mind, I have computed the difference of the two statistics for different stock indices. This difference, if it is significant, means that investors react more strongly to index A than to index B. That's where the need for this test comes from.

If an alternative measure of difference in distribution is more amenable to this kind of test, it could be used as an alternative to KS.

$\endgroup$
4
  • 3
    $\begingroup$ Are you willing to assume that $x$ and $y$ are independent? (I can't really make enough sense of the economic interpretation to have my own opinion on that.) If they are dependent, the distribution of the KS differences will surely depend on the dependence structure. $\endgroup$ Commented Aug 25, 2021 at 22:14
  • $\begingroup$ The two indices have a historical correlation of about 0.70, so independence is a strong assumption to say the least. $\endgroup$
    – Constantin
    Commented Aug 27, 2021 at 9:49
  • $\begingroup$ Might it still be useful to start thinking about how this could be done under independence and then relaxing that assumption in a second step? $\endgroup$
    – Constantin
    Commented Aug 27, 2021 at 10:08
  • $\begingroup$ Your question interpreted as a research project in theoretical statistics, this might be a good way to start, however I don't think it will lead to anything in a fast and straightforward way (i.e., in a way somebody could work out with the kind of effort that people are willing to put into postings here). So I'm rather pessimistic. If something good comes up, I'll be impressed. (There may be something to dig out from the literature but I don't know it.) $\endgroup$ Commented Aug 27, 2021 at 10:14

1 Answer 1

1
$\begingroup$

You do not fully explain why the test statistic $D$ in a two-sample K-S test "takes on a specific econometric meaning." My demonstration below illustrates the specific geometric meaning ot $D.$

set.seed(2021)
x = rgamma(100, 5, 10)
y = rgamma(120, 5, 12)

summary(x)
   Min. 1st Qu.  Median    Mean 3rd Qu.    Max. 
 0.1107  0.3149  0.4280  0.4780  0.5697  1.3300 
summary(y)
   Min. 1st Qu.  Median    Mean 3rd Qu.    Max. 
0.05264 0.28474 0.37425 0.40804 0.51669 1.02420 

Notice that sample x tends to have larger values.

ks.test(x,y)

        Two-sample Kolmogorov-Smirnov test

data:  x and y
D = 0.175, p-value = 0.07081
alternative hypothesis: two-sided

Notice that the K-S test is not significant at the 5% level.

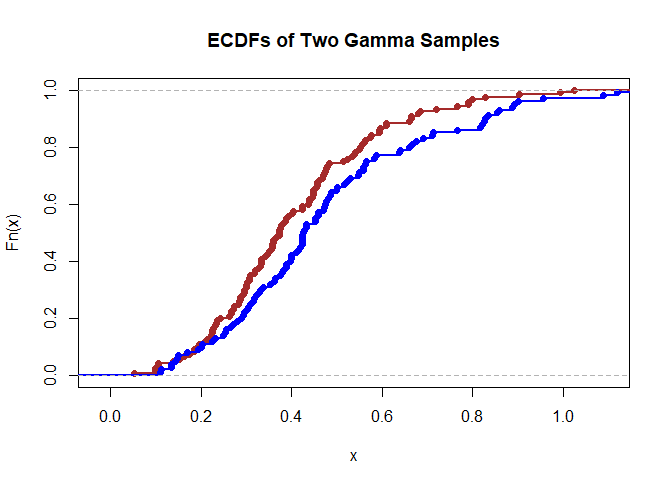
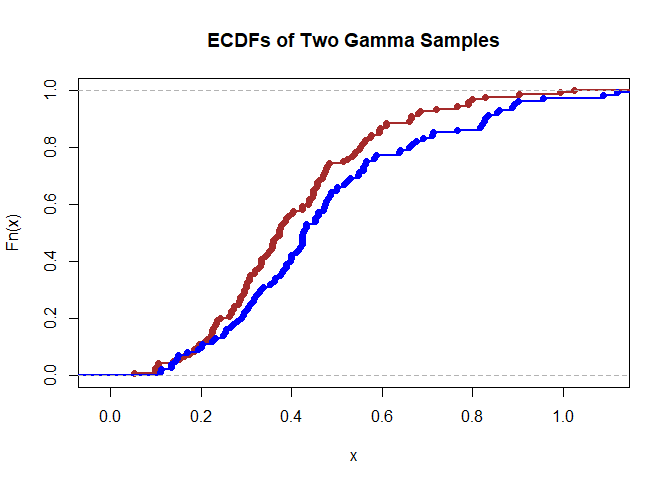
The statistic $D = 0.175$ is the maximum vertical difference between the empirical CDFs (ECDFs) of the two samples.

enter image description here

hdr = "ECDFs of Two Gamma Samples"
plot(ecdf(y), col="brown", lwd=2, main=hdr)
 lines(ecdf(x), col="blue", lwd=2)

enter image description here

From the ECDF plots it seems clear than the first sample (blue) stochastically dominates the second. (The blue ECDF is shifted to the right of the brown one, thus plotting below the brown one.

By contrast, the two-sample Wilcoxon rank sum test does find a significant difference at the 5% level.

wilcox.test(x,y)$p.val
[1] 0.0336712

Now, let's repeat the demonstration with two larger samples:

set.seed(823)
x = rgamma(500, 5, 10)
y = rgamma(700, 5, 12)

summary(x)
   Min. 1st Qu.  Median    Mean 3rd Qu.    Max. 
0.04991 0.34326 0.47111 0.49905 0.62582 1.37605 
summary(y)
   Min. 1st Qu.  Median    Mean 3rd Qu.    Max. 
0.02575 0.28688 0.39246 0.41528 0.51581 1.23148 

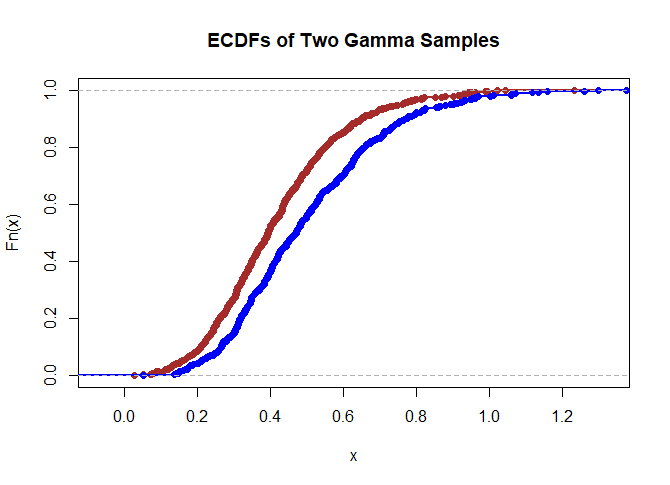
Means and medians differ by about the same amount as for the the smaller samples.

The K-S test statistic is $D = 0.168$ is about the same as before, but here it occurs at about $0.6.$ But here the difference is highly significant (P-value near 0.)

ks.test(x,y)

        Two-sample Kolmogorov-Smirnov test

data:  x and y
D = 0.16829, p-value = 1.338e-07
alternative hypothesis: two-sided

enter image description here

The Wilcoxon SR test also gives a highly significant result.

wilcox.test(x,y)$p.val
[1] 4.879207e-12

Comment: From a statistical point of view the Wilcoxon test statistic has considerably better power to distinguish between data from $\mathsf{Gamma}(\mathrm{shape}=5,\mathrm{rate}=10)$ and $\mathsf{Gamma}(5, 12).$ So I'm surprised that the K-S statistic is the one with "specific economic meaning." Can you provide an explanation of the meaning of $D$ that would be comprehensible to someone who is not much of an economist?

$\endgroup$
1
  • $\begingroup$ Please note that I referred to the meaning as “economic”, rather than “econometric.” I have added an explanation of this economic meaning to the question, though I do not believe it's strictly necessary to answer the question. $\endgroup$
    – Constantin
    Commented Aug 24, 2021 at 20:00

Your Answer

By clicking “Post Your Answer”, you agree to our terms of service and acknowledge you have read our privacy policy.

Not the answer you're looking for? Browse other questions tagged or ask your own question.