3
$\begingroup$

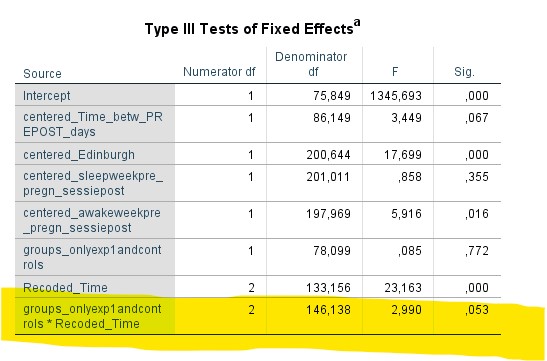
I have a question regarding the interpretation of an interaction effect in my mixed model analysis. There are two groups (experimental and control) and three measurement points (time). In addition several variables are added to the model as covariates. Results show an (just) not significant interaction effect of group x time F(2,146.14)= 2.99, p=.053.
When looking however, at the estimates of fixed effects the beta value for time 1 to time 2 is significant (B=3.23 p=.016.) whereas the beta coeficient for time 1 to time 3 is not significant (B=1.88 p=.166). 2
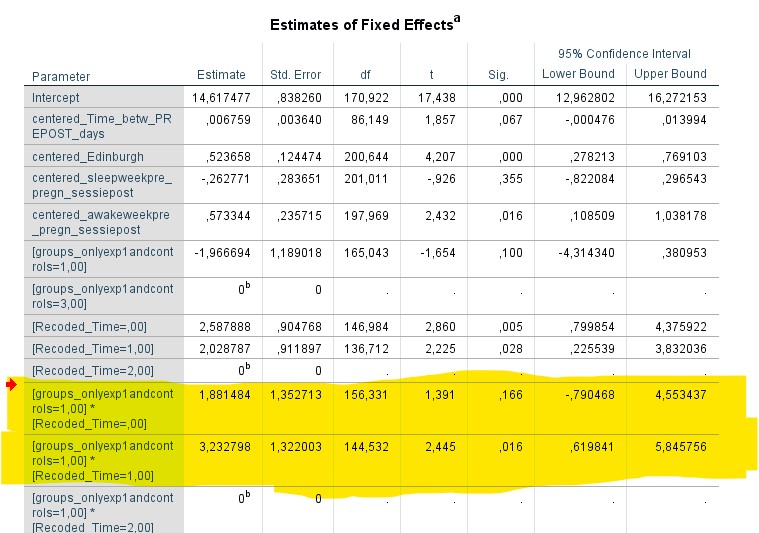
As far as I understood, you don’t interpret the estimates of fixed effects when the interaction effect is not significant. Still it seems strange to ignore this significant beta coeficient of p=.016. (I know that the p-value of .050 is arbitrary and discussable, but this is the value I’ll need to use). How could I best report/interpret this?

$\endgroup$

1 Answer 1

2
$\begingroup$

The first table shows that, if you insist on using a threshold for "statistical significance" of 0.05, that the interaction term does not improve the model fit. However, if there is really no improvement in fit by adding the interaction we still might find one of more "significant" estimates of the individual levels of the interaction (as you have), and given that we know the interaction doesn't improve the model, the "significant" results are spurious and the interaction term should be excluded from the model altogether.

If your research question is directly concerned with this interaction, then I would suggest that you report the results verbatim and allow the reader to make up their mind about how to interpret the results. If not, then just remove the interaction and put a note in your methods somewhere that you did explore it. It will be important to inform the reader whether or not you conducted a sample size calculation prior to collecting the data. Did the study have sufficient statistical power to detect the effect size(s) for the interaction that you are interested in ? If not, then much of the above is moot.

Finally, don't lose sight of the big picture. Look at the effect sizes too. I don't know anything about your study, but it looks like the effect sizes of those interactions are quite interesting in themselves. This is where p-values can't really help you. The first table shows a p-value of 0.053. Perhaps if you had 1 more participant in your study, it would have been 0.0499 and we would not be having this conversation.

$\endgroup$
1
  • $\begingroup$ Thank you for your clear explanation, this is really helping me forward. $\endgroup$
    – Rose
    Commented Sep 10, 2021 at 12:10

Your Answer

By clicking “Post Your Answer”, you agree to our terms of service and acknowledge you have read our privacy policy.

Not the answer you're looking for? Browse other questions tagged or ask your own question.