1
$\begingroup$

Please advise if CLT is related to p-value calculation.

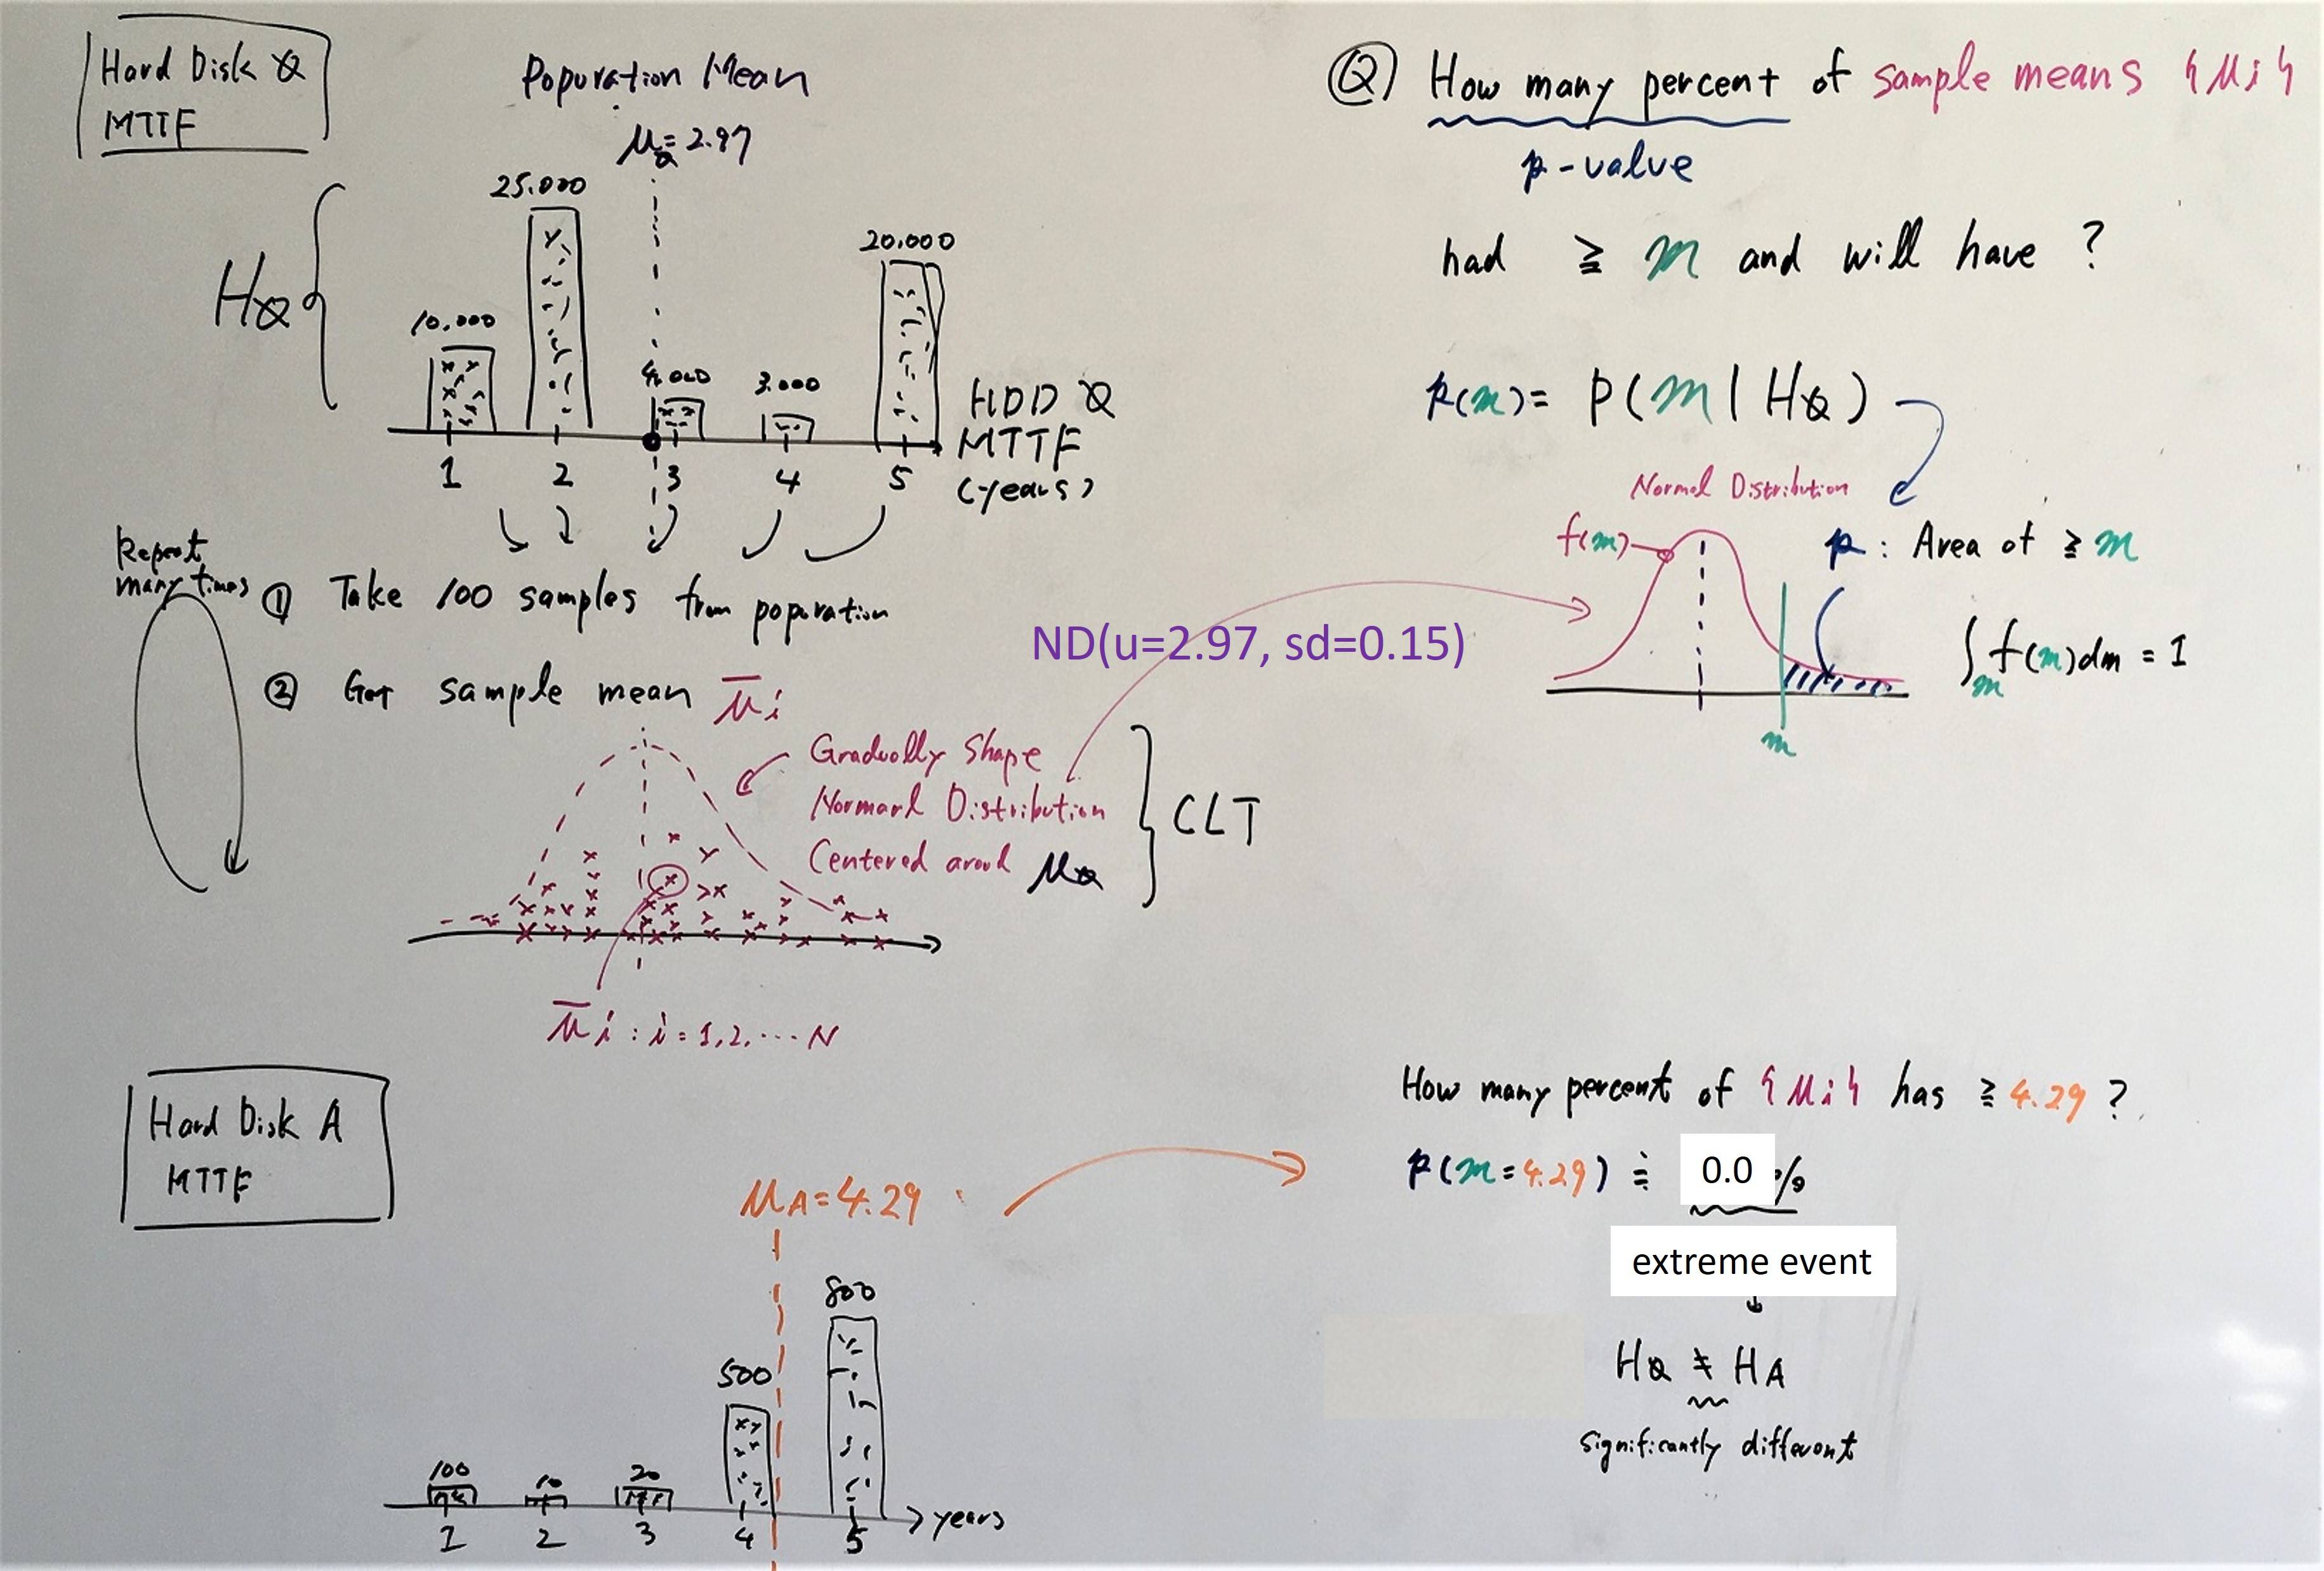
Suppose there is a Hard Disk Drive (HDD) type 0 called $H_0$. The MTTF (Mean Time to Failure) data has been collected and its mean $\mu=2.97$.

Then, run random sampling (sample size 100) from $H_0$.

  1. Take 100 samples and calculate the sample mean $\overline{\mu}$ of MTTF.
  2. Repeat the step 1 many many times.
  3. Plot the histogram of the $\overline{\mu}$

According to CLT, $\overline{\mu}$ will form a normal distribution $ND$ with the mean $\mu=2.97$.

Question

Can p-value be calculated from the normal distribution $ND$ from the sampling above? For instance, to get p-value for $(MTTF>=4.29)$, use the cdf function of a normal distribution and calculate the size of the area on the right of $4.97$?

If it can be calculated, then can I say p-value is based on CLT?

enter image description here

$\endgroup$
0

2 Answers 2

1
$\begingroup$

No, the p-value is the probability of getting an effect as or more extreme than that observed in your sample, in datasets generated under the identical design and sampling scheme used for your study, when there is no effect.

In your example, the p-value is associated to a z-score of the normal distribution. Your notation here might also be confusing since $H_O$ is commonly used for the null hypothesis.

$\endgroup$
3
  • 2
    $\begingroup$ No, the p-value is the probability of getting an effect as or more extreme than that observed in your sample, in datasets generated under the identical design and sampling scheme used for your study, when there is no effect. $\endgroup$ Commented Sep 7, 2021 at 11:45
  • $\begingroup$ Thanks @FrankHarrell, I have updated the answer to reflect your comment. $\endgroup$
    – l.apprenti
    Commented Sep 7, 2021 at 12:05
  • $\begingroup$ I saw that @l.apprenti fixed it already! Thanks. $\endgroup$
    – Pitouille
    Commented Sep 7, 2021 at 12:07
0
$\begingroup$

I saw that you asked a related question... which has already answers and comments. You got already lot of information about the topic.

I am re-editing my answer in light of what has been shared already because I would like to adapt it to your specific example, I feel that if you start with the right story, it will ease your learning process. So, I will not go through the details since you have already a lot.

You know some characteristics about HDDs of brand K (the population you are interested in). For instance you know that, in average, the time to failure is $\mu=2.97$ with a standard deviation of $\sigma=0.15$ (note that Greek letters are usually used for population parameters).

Now you want to know whether the last production of HHDs differs from what you know about the population. In other words, you are wondering whether the mean of the last production equals the one of the previous productions i.e. $\mu=2.97$. Unfortunately, you cannot test the entire production because it represents 1,000,000 units. So, you can only test a (random) sample (of size n=100 in your example) that will represent this last production.

So, the question is to determine whether your sample is different from the population you know. Therefore, you have to hypothesis:

  1. There is no difference: the mean of the sample equals the mean of the population (null hypothesis $H_0$)
  2. The means of the sample and the population are different (alternative hypothesis $H_a$)

Then, you will perform a test to determine the p-value you were looking for (which has been covered already in the other question) and which help to reject (or not) the null hypothesis in favor of the alternative hypothesis.

Also, a comment on the steps you described (iteration of taking random samples of the same the size and calculate the mean of each sample) is called the sampling distribution of the mean. This "process" is a mental illustration of the CLT which states that as the size of the sample gets sufficiently large, the sampling distribution of the mean (among multiple samples) will approximate a normal distribution where the mean equals the population mean.

$\endgroup$

Your Answer

By clicking “Post Your Answer”, you agree to our terms of service and acknowledge you have read our privacy policy.

Not the answer you're looking for? Browse other questions tagged or ask your own question.