0
$\begingroup$

I don't have a background in statistics but currently learning the basics. I want to do a stochastic simulation, which I assume here I should iterate my simulation multiple times. And I am stuck now on what to do next.

What I've done so far:

  1. Generate random values with normal distribution, in this case, the mean, standard deviation and number of events (population) are predefined. (0.5,0.2 and 1000 respectively)
  2. Iterate the simulation 100 times (100 scenarios) (not sure if the number of simulations is good)

Now I am stuck, I want to multiply each value with 100000 from population 1 to population 1000, which is derived from the best simulation scenario (out of 100 scenarios). How do I know which simulation scenario is the best one?

Note: My tool is Python

$\endgroup$
5
  • 4
    $\begingroup$ What is the purpose of the simulation? $\endgroup$ Commented Sep 12, 2021 at 16:22
  • 1
    $\begingroup$ What is a "simulation scenario"? In which sense is one "best"? What is the difference between the 100 replications in 2. (beyond sheer randomness)? Why does it matter than the code is written in Python? $\endgroup$
    – Xi'an
    Commented Sep 12, 2021 at 16:34
  • $\begingroup$ @MehmetSüzen so the task is to simulate the loss ratio caused by flood, with 1000 events (here means the population), std deviation is known and the mean loss ratio is also known $\endgroup$
    – Sara Lee
    Commented Sep 12, 2021 at 16:38
  • $\begingroup$ @Xi'an what I meant by "simulation scenario" is the generated random value, the difference is just the randomness, probably there is a better tool for the calculation $\endgroup$
    – Sara Lee
    Commented Sep 12, 2021 at 16:39
  • 2
    $\begingroup$ Could you write the event whose probability you want to simulate via this experiment in mathematical terms? Like, e.g.,$$\text{Pr}(\bar{X}_n\ge x_0)$$if you are looking for an extreme flooding event. The term "loss ratio" need be defined precisely as well. $\endgroup$
    – Xi'an
    Commented Sep 12, 2021 at 16:41

1 Answer 1

1
$\begingroup$

[I will speculate about what you are trying to approximate by simulation. At least the following will show one format for simulation in R that you may be able to adapt to your work in Python.]

Suppose an individual flood has $X \sim \mathsf{Norm}(\mu=5,\, \sigma=0.2).$ And suppose you want to know about the average $A =\bar X_{1000}$ of $n = 1000$ floods; in particular, you want to find $P(A > 5.01).$

Then the exact theoretical answer can be found by using the distribution of $A,$ which is $$A \sim \mathsf{Norm}(\mu = 5,\, \sigma=.2/\sqrt{1000}).$$ By a direct computation in R, where pnorm is a normal CDF, we find $P(A > 5.01) = 1 - P(A \le 5.01) = 0.0569:$

1 - pnorm(5.01, 5, .2/sqrt(1000))
[1] 0.05692315

Now suppose you are not yet familiar with the relationship for the distribution of $A,$ displayed above. And you are asked to do a simulation to approximate $P(A > 5.01).$

There are various formats for doing such a simulation in R. I will illustrate one of them. A thousand iterations is not enough to get reasonable accuracy, so I will use 100,000. Thus, the vector a will contain 100,000 simulated averages. The result is $P(A > 5.01) = 0.0575 \pm 0.0007.$

set.seed(2021)
a = replicate(10^5, mean(rnorm(1000, 5, .2)))
summary(a);  length(a);  sd(a)
   Min. 1st Qu.  Median    Mean 3rd Qu.    Max. 
  4.973   4.996   5.000   5.000   5.004   5.026 
[1] 100000        # sample size
[1] 0.006326662   # sample SD
mean(a > 5.01)
[1] 0.05749       # aprx P(A > 5.01)
sd(a > 5.01)/sqrt(10^5)
[1] 0.0007361076  # aprx 95% margin of sim error

The logical vector a > 5.01 has 100,000 TRUEs and FALSEs; its mean is the proportion of its TRUEs.
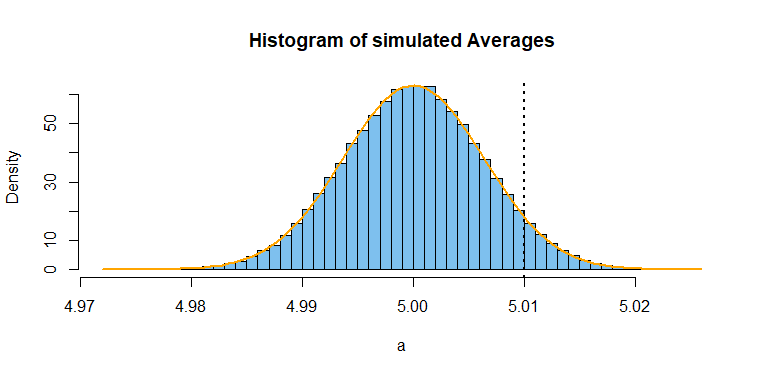
enter image description here

hist(a, prob=T, br=40, col="skyblue2", 
       main="Histogram of simulated Averages")
 curve(dnorm(x, 5, .2/sqrt(1000)), add=T, col="orange", lwd=2)
 abline(v = 5.01, lty="dotted", lwd=2)
$\endgroup$
2
  • 1
    $\begingroup$ It would be straightforward to deduce exactly how many iterations are "enough" in this setting. $\endgroup$
    – Xi'an
    Commented Sep 12, 2021 at 18:10
  • $\begingroup$ Yes. And not surprisingly, I have found that $10^5$ are enough to get about two place accuracy for simulated means and probabilities, and $10^6$ often give three place accuracy. $\endgroup$
    – BruceET
    Commented Sep 12, 2021 at 18:14

Your Answer

By clicking “Post Your Answer”, you agree to our terms of service and acknowledge you have read our privacy policy.

Not the answer you're looking for? Browse other questions tagged or ask your own question.