5
$\begingroup$

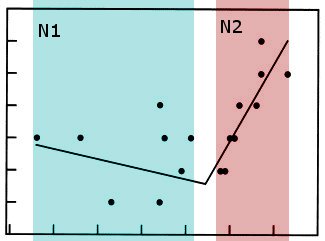
I have a set of data points with a total number of Nt. I know a priori that the data comes from two distinct processes (distributions). I am trying to find the optimal model parameters together with the optimal partitioning for the dataset; such that N1+N2=Nt. I want to use the Bayesian Information Criterion, my question is which of the following BIC expressions is the correct one to optimize: As an example I will assume the problem of bi-linear fit of a dataset enter image description here

BIC= LogLikelihood - 0.5*k*log(N) [k: free parameters, N: number of datapoints]

1) Two separate linear fit models: LL(M1) - log(N1) + LL(M2) - log(N2) (k=2 for linear fit)

2) One single bi-linear fit model: LL(M)-2.5*log(Nt) (k=5; 4 (2 linear fits) + 1 (split point))

$\endgroup$

2 Answers 2

2
$\begingroup$

First, a non-answer, then a kind-of answer.

BIC - and other information criteria such as AIC - are really meant for model comparison (which involves two different models, not two estimates of the same model) than for model evaluation (which only involves one model.) You can see that by writing out the expression for BIC:

$\text{BIC} = -2\ln L(\hat{\theta};x) + k \ln N$

where $L(\cdot;\cdot)$ is the likelihood function, $k$ is the number of parameters to be estimated, etc. In your case, you are specifying a model with an unknown breakpoint, but you're not comparing it to anything, so far as I can tell. If you attempt to use BIC as a tool for selecting the best estimates, observe that regardless of what the estimates are, the term $k \ln N$ will remain the same, so you will in effect just be maximizing the other term, which is the log likelihood function, and getting the MLE. No need (or value add) for BIC in this case!

Now, if you were comparing two different model formulations, e.g., one with the data split at an unknown to-be-estimated breakpoint $m$ and each part fit to a model with $n_1$ and $n_2$ parameters respectively, and comparing that to a model with no breakpoint but $n_3$ parameters, you'd have $k_1 = n_1 + n_2 + 1$ (for $m$) for the first model and $k_2 = n_3$ for the second model. Judging from the graph above, you have a constraint that forces the fits on the "left" and "right" parts of the data set to intersect at the breakpoint; this constraint would typically remove one free parameter from the parameter count (as the estimates have to satisfy the constraint, and typically this can be done by making one parameter a function of all the others including the location of the breakpoint, so it's not a free parameter any more.) In such a case, $k_1 = n_1 +n_2$, as we subtract 1 from the previous expression for $k_1$ of $n_1 + n_2 + 1$.

However, if you know the breakpoint, you don't add 1 for it to the expression for $k$. A heuristic explanation is that it's not a parameter to be estimated, so it doesn't count against model complexity. There's a real math explanation for this also, but perhaps this isn't the place to go over that.
$\endgroup$
1
  • $\begingroup$ Dear Sir, thank you very much for your answer. The whole thing became much clearer now. $\endgroup$ Commented Oct 1, 2013 at 8:34
2
$\begingroup$

Is it correct that you don't actually know which data points go with each process (distribution)?

One idea is to use a finite mixture regression model. You estimate the parameters from your linear model, but allow these to be freely estimated across latent classes (2 in this case). The prior probability of class membership is also estimated. Observations can then be assigned posterior class membership proabilities, perhaps helping you see which observations come from which process. For a better explanation than I could give, see http://sites.stat.psu.edu/~dsy109/Rao_Talk.pdf

Certainly doable in Mplus (which is what I use) and R (which I am much less familiar with for this kind of modelling).

$\endgroup$
2
  • $\begingroup$ Well, as stated in the question, this is exactly the point: I know that the data comes from two distinct processes, so there is no mixture. You can think of it as a piece-wise pdf. A mixture model would be more like a joint pdf, where both pdfs are active through out the whole range. In a piece-wise model each data gets its likelihood strictly from one pdf only. $\endgroup$ Commented Apr 3, 2013 at 21:34
  • $\begingroup$ You stated that they came from 2 distributions, but not whether you knew where each point came from. Thanks for the clarification. Sorry I couldn't be more helpful. $\endgroup$
    – D L Dahly
    Commented Apr 3, 2013 at 23:18

Your Answer

By clicking “Post Your Answer”, you agree to our terms of service and acknowledge you have read our privacy policy.

Not the answer you're looking for? Browse other questions tagged or ask your own question.