1
$\begingroup$

I think I am on the right track, but I would rather know.

Initially, when the results of Levene's and Shapiro's were significant at 95%, I tested and investigated the data in various ways. I used Fligner, Anderson, Kolmogorov, and Lilliefors - what I found was consistent results. All of the tests returned a p-value between .01 and .05.

Initial results:

  • Levene's p < .02581
  • Shapiro's p < .03673
  • ANOVA p < .0001265

*** All tests of the distribution were assessed with the residuals.

My initial thought and question now - I know that there is no reason to discount a p-value in some imaginary world of only 95% matters - because that is the opposite of intelligent (being as professional as I can here) --

Is it accurate to say that if the assumptions are not significant at 99% (therefore fail to reject) and the ANOVA is significant at the 99% CI, the assumptions are not violated, and the results of the ANOVA are reliable?

If not, what else can I look for to get a better understanding? Where did I go wrong?

** Outliers? Using the Mahalanobis distance, there were none. Using GVLMA, all the assumptions were met. (That is another little world of 'very interesting.')

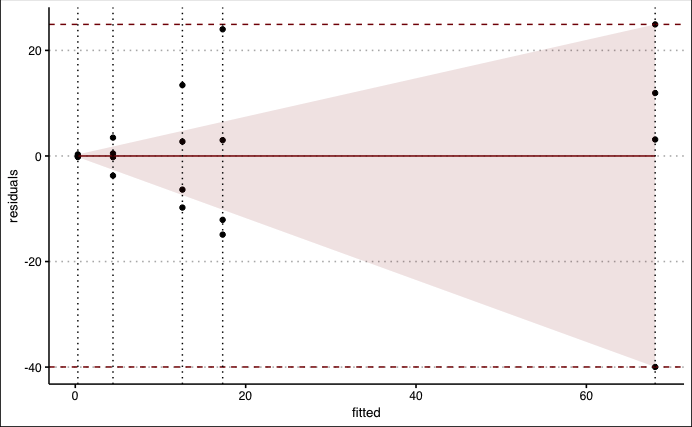
For clarity, I've added the variance visualized. The vertical, dashed black lines indicate the five groups. The red background reflects the widest to the narrowest range among the groups' variance. The red horizontal line is the trend line, not a line marking zero (although it does both, here).

enter image description here

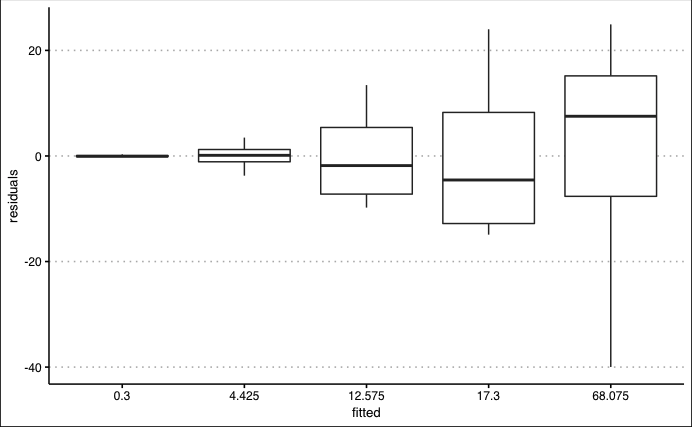
A boxplot of the residuals:

enter image description here

$\endgroup$
3
  • 1
    $\begingroup$ Relevant: stats.stackexchange.com/questions/2492/… $\endgroup$
    – AdamO
    Commented Sep 22, 2021 at 16:30
  • 1
    $\begingroup$ An analysis of the logarithms of the data likely would be more revealing, assuming no data are zero or negative. $\endgroup$
    – whuber
    Commented Sep 22, 2021 at 20:53
  • $\begingroup$ @whuber they are, in relative terms, exponential, good call! I will try that. $\endgroup$
    – Kat
    Commented Sep 22, 2021 at 21:24

1 Answer 1

1
$\begingroup$
  1. Hypothesis testing is not a means of performing sensitivity analyses. Looking at a range of $p$-values does not give you an idea about what a possible significance level should be.

  2. You need to use graphical tools, like a histogram and QQ-plot, to look at the distribution of residuals. Since the main test is an ANOVA, the simple box-and-whisker plot of response by group is probably the most useful tool you have.

  3. The normality of conditional response, in my experience, matters very little except in cases where the sample size is very, very small. When this is the case, tests like the Shapiro and Levene have very little power to detect normality, so their utility is paradoxical. Just don't bother reporting normal tests.

  4. The sandwich variance estimator is far better behaved in small samples when using the "HC3" correction as discussed in MacKinnon and White (1985). Sandwich variance gives a consistent and unbiased test of mean differences for non-normal data in finite samples.

$\endgroup$
4
  • $\begingroup$ I have graphed the variance, the distribution, the points, etc. I tried to look at this information in many different ways before putting this question out there. With the sample size so small, I am not sure if I am looking at it correctly. I added an image of the fitted versus residuals. The vertical black lines indicate the five groups. $\endgroup$
    – Kat
    Commented Sep 22, 2021 at 20:28
  • $\begingroup$ I was lost for a bit, then came to the face smack. I think what you meant at the onset of your answer is that the p-value is calculated, considering the alpha, and you can't change the alpha or CI 'posthumously.' Is that what you meant? Gah! My original question was so ------ good thing no one can recognize me on the street from my Stack Exchange profile. (sigh) $\endgroup$
    – Kat
    Commented Sep 22, 2021 at 21:57
  • $\begingroup$ @Kat don't worry, it's a prevalent issue in the literature, but this is a stats site, I'm a statistician, and we understand the issues with hypothesis testing. I observe two noteworthy things: the "outlier" with y-hat = 68 with resid=-40; also the box plot shows a heteroscedastic increase in variance with fitted value. You should consider the sandwich estimator to handle the heteroscedasticity. And you should fit results without the outlier as a sensitivity analysis (keep it in for the primary analysis, and comment on any difference). $\endgroup$
    – AdamO
    Commented Sep 23, 2021 at 15:43
  • $\begingroup$ I wonder about your statement on the assessment of normality. I am not a statistician, but I always check the distribution, focusing on why it might be an outlier. I rely far more on the Mahalanobis distance (and occasionally the chi-square QQ plot), skew, and kurtosis than something like Shapiro-Wilk. Outliers have such a huge influence on frequentist statistics. Do you package that all up and ignore it? Using the sandwich estimator (HC3), original: p = .0001 95[13.08, 28.00] to after: p = .0000, 95[12.61, 28.46]. Although transforming by the log worked great all around. $\endgroup$
    – Kat
    Commented Sep 23, 2021 at 20:02

Your Answer

By clicking “Post Your Answer”, you agree to our terms of service and acknowledge you have read our privacy policy.

Not the answer you're looking for? Browse other questions tagged or ask your own question.