1
$\begingroup$

I have a dataset of 48,000 records

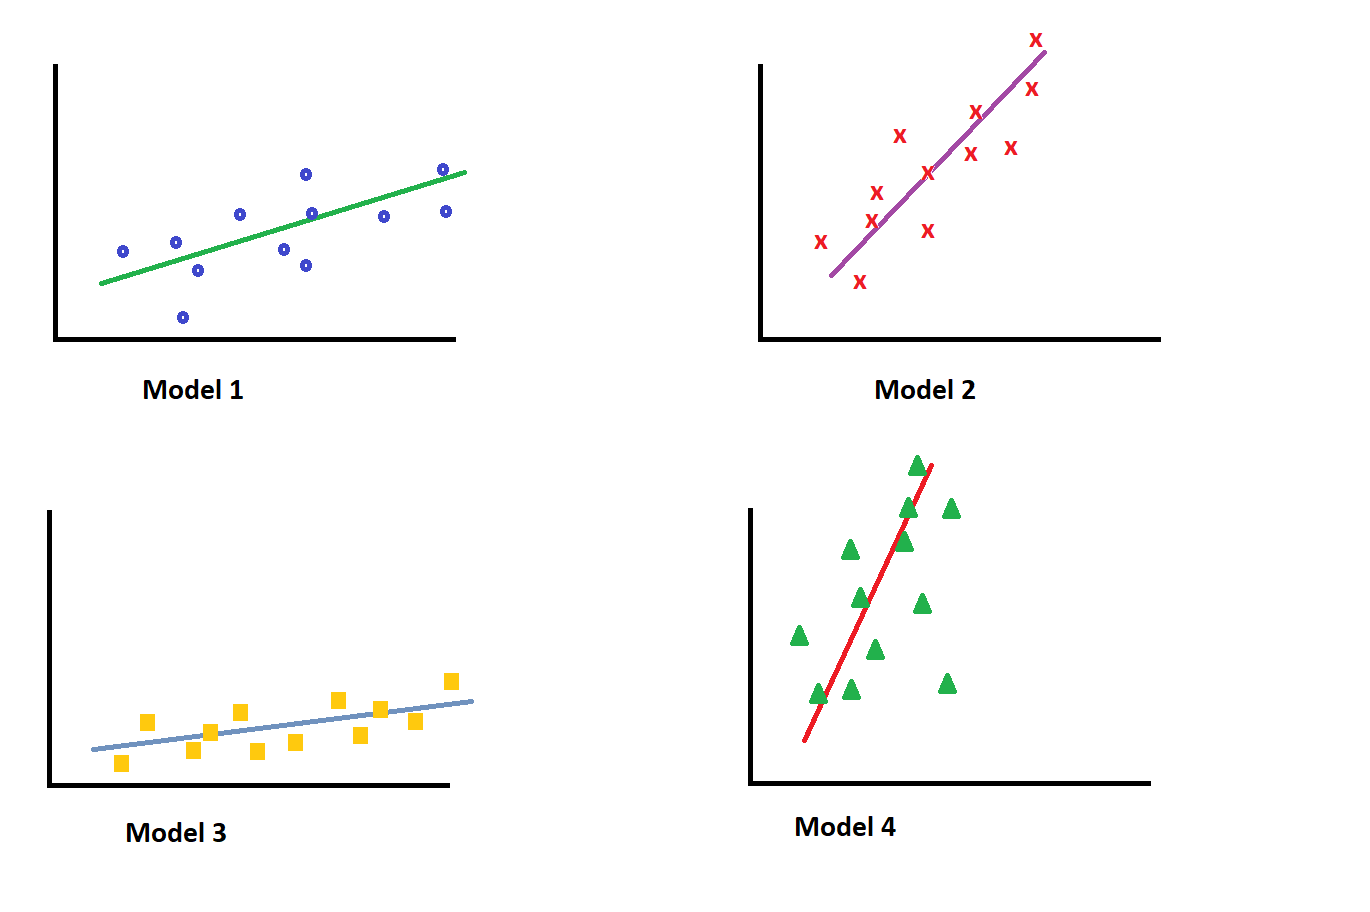
These records are divided equally into 4 groups

Blue Group, Yellow Group, Green Group, and Red Group

Each one of these groups has 12,000 records

My study has resulted in 4 regression models

enter image description here

Model 1 equation was $a_1 x + b_1$

Model 1 equation was $a_2 x + b_2$

Model 1 equation was $a_3 x + b_3$

Model 1 equation was $a_4 x + b_4$

The thing is that the dataset is not available anymore and I want the regression model for all dataset points

Can I get the average of all 4 models to get the regression for all data points?

So it will be $((a_1 + a_2 + a_3 + a_4)/4) x + (b_1 + b_2 + b_3 + b_4)/4$

is this model the right model for all data points?

$\endgroup$
4
  • 1
    $\begingroup$ Are all four models using the same dependent variable? Was the split of the data (into the four coloured groups) random or based on an observable variable? $\endgroup$ Commented Oct 3, 2021 at 8:22
  • $\begingroup$ will it make a difference? they all have exact same number of records $\endgroup$
    – asmgx
    Commented Oct 3, 2021 at 13:13
  • $\begingroup$ Although one can compute a single regression for all data points, if you include model assumptions such as i.i.d. normal errors, the model for all points combined can't be "correct" if the four individual models are correct (unless in reality they are all equal), because the combined model then can't be a single linear regression but would be a mixture of four of them, which is different. Nonetheless of course you can compute a regression that produces a "compromise" of them. $\endgroup$ Commented Oct 3, 2021 at 21:26
  • $\begingroup$ Were the samples divided into groups randomly or there was some criteria for that? $\endgroup$
    – Tim
    Commented Oct 3, 2021 at 21:52

3 Answers 3

4
$\begingroup$

I tried it

set.seed(1)

x = 1:20
y = x + rnorm(20)

lm(y[1:10] ~ x[1:10])
lm(y[11:20] ~ x[11:20])
lm(y~x)

and it doesn't work. The coefficients of a regression, is not the same as the average of the coefficients of two half regressions.

Call:
lm(formula = y[1:10] ~ x[1:10])

Coefficients:
(Intercept)      x[1:10]  
    -0.1688       1.0547  


Call:
lm(formula = y[11:20] ~ x[11:20])

Coefficients:
(Intercept)     x[11:20]  
    -0.5036       1.0485  


Call:
lm(formula = y ~ x)

Coefficients:
(Intercept)            x  
   -0.03609      1.02158  

But while you do not get the exact same result as a single regression. The mean of 4 independent regressions does give you a more precise estimate. Since the average of multiple estimates will have less variance. So yes, you could use the average of the multiple regressions.

With some more information one could tell if there are smarter ways to combine the figures. E.g. when the data is not the same then the estimates can have different precision and for that case you could use a weighted estimate in which you do not count every result the same. (For instance, in the above example the intercept does not have the same error in the two splits because the vector $x$ is shifted. And this changes the error. Using the first more precise estimate of the intercept is better than using the average.)

Also, with some more information one might get to the conclusion that the groups are not to be averaged. If there is something meaningful different about the groups then they could have different regression lines which should not be grouped.

$\endgroup$
1
$\begingroup$

The answer is no. You were learning the coefficient independently without considering the 4 features together.

Let me use a simple example to explain.

Assume the real regression result is: $10*x_1 -1*x_2 = y$

Assume in your samples $x_1, x_2$ have a positive relationship with $y$. Meaning when $x$ increases $y$ increases too. This is not too hard to do by choosing the samples, e.g.

1, 2 -> 8,
2, 3 -> 17,
3, 4 -> 26
...

Learning coefficient of $x_1, x_2$ separately will always give positive coefficients $a_1, a_2$.

Never will it learn $-1$.

$\endgroup$
0
$\begingroup$

If you have the covariance matrix of the estimated model parameters, too, then you effectively have - what are from a certain perspective - the sufficient statistics. What do I mean with "from a certain perspective"? I mean that you need to assume that each dataset is governed by an intercept + slope model.

You can then describe the model fits e.g. via a normal-inverse-gamma sampling distribution and fit some suitable model on top (either assuming some parameters are the same and/or e.g. vary according to random effects between the different colors). This will then reflect that amongst other things the uncertainty about parameters will differ between separate models depending on the variation in the data and number of data points.

$\endgroup$

Your Answer

By clicking “Post Your Answer”, you agree to our terms of service and acknowledge you have read our privacy policy.

Not the answer you're looking for? Browse other questions tagged or ask your own question.