I have the following question: Can Decision Trees be used to identify Clusters ("Cohorts") within the Data?
I present my question in the context of Survival Analysis Regression (using the R programming language). Suppose we take the "veteran" dataset that contains bio-medical information and survival times on war veterans collected during a medical study:
#load libraries
library(survival)

 head(veteran)
  trt celltype time status karno diagtime age prior
1   1 squamous   72      1    60        7  69     0
2   1 squamous  411      1    70        5  64    10
3   1 squamous  228      1    60        3  38     0
4   1 squamous  126      1    60        9  63    10
5   1 squamous  118      1    70       11  65    10
6   1 squamous   10      1    20        5  49     0
In the above dataset, the veterans were classified into "cohorts" based on the treatment ("trt") they received. But suppose we wanted to consider alternate methods to create "cohorts" within the data.
I am wondering if the following strategy makes sense:
1) Run a (regression) decision tree algorithm on this data and see which terminal nodes of the decision tree the veterans fall under.
2) Provided that the decision tree from step 1) fits the data well, create a separate regression model for veterans in each terminal nodes. Consider pruning and collapsing several terminal nodes into a single node if some of the terminal nodes are sparsely populated.
I illustrate this strategy below:
1) Create Decision Tree
#load libraries
library(rpart)
library(rpart.plot)

#fit regression decision tree
tree = rpart( time ~., data = veteran,   control = rpart.control(minsplit = 20, cp = 0.005,  xval = 0), parms = list(split = "gini"))

#plot tree
rpart.plot(tree)
The corresponding 4 cohorts ("rules") identified in this tree are:
rpart.rules(tree)

 time
   43 when celltype is smallcell or adeno & karno <  55
   91 when celltype is smallcell or adeno & karno >= 55
  111 when celltype is  squamous or large & karno <  65
  255 when celltype is  squamous or large & karno >= 65
And we can see how well this tree fits the data:
printcp(tree)

Regression tree:
rpart(formula = time ~ ., data = veteran, parms = list(split = "gini"),
    control = rpart.control(minsplit = 50, cp = 0.005, xval = 0))

Variables actually used in tree construction:
[1] celltype karno

Root node error: 3387232/137 = 24724

n= 137

        CP nsplit rel error
1 0.135786      0   1.00000
2 0.094872      1   0.86421
3 0.012502      2   0.76934
4 0.005000      3   0.75684
2) Creating Individual Survival Models
We can isolate the rows from the original data corresponding to the 4 cohorts that were identified:
    #cohort 1

    cohort_1 <- veteran[which((veteran$celltype == "smallcell" |  veteran$celltype  == "adeno") & veteran$karno < 55   ), ]

cohort_1$cohort = 1
cohort_1$cohort = as.factor(cohort_1$cohort)

    #cohort 2

    cohort_2 <- veteran[which((veteran$celltype == "smallcell" |  veteran$celltype  == "adeno") & veteran$karno > 55   ), ]

cohort_2$cohort = 2
cohort_2$cohort = as.factor(cohort_2$cohort)

    #cohort 3

    cohort_3 <- veteran[which((veteran$celltype == "squamous" |  veteran$celltype  == "large") & veteran$karno < 65   ), ]

cohort_3$cohort = 3
cohort_3$cohort = as.factor(cohort_3$cohort)

    #cohort 4

    cohort_4 <- veteran[which((veteran$celltype == "squamous" |  veteran$celltype  == "large") & veteran$karno > 65   ), ]

cohort_4$cohort = 4
cohort_4$cohort = as.factor(cohort_4$cohort)

#merge together
cohort_data = rbind(cohort_1, cohort_2, cohort_3, cohort_4)
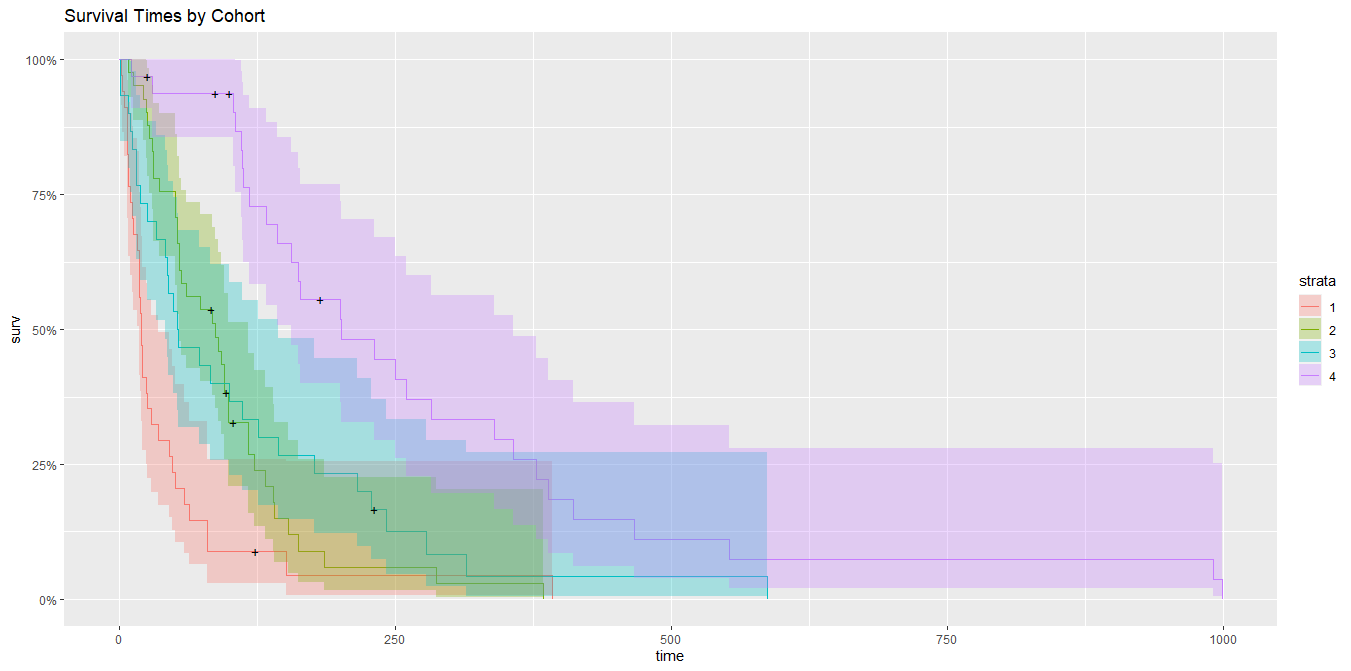
Then, we can fit individual survival models to each of the 4 cohorts and visualize the results:
library(ggfortify)

#cohort level analysis
km_trt_fit <- survfit(Surv(time, status) ~ cohort, data= cohort_data)

#visualize results

autoplot(km_trt_fit, main = "Survival Times by Cohort")
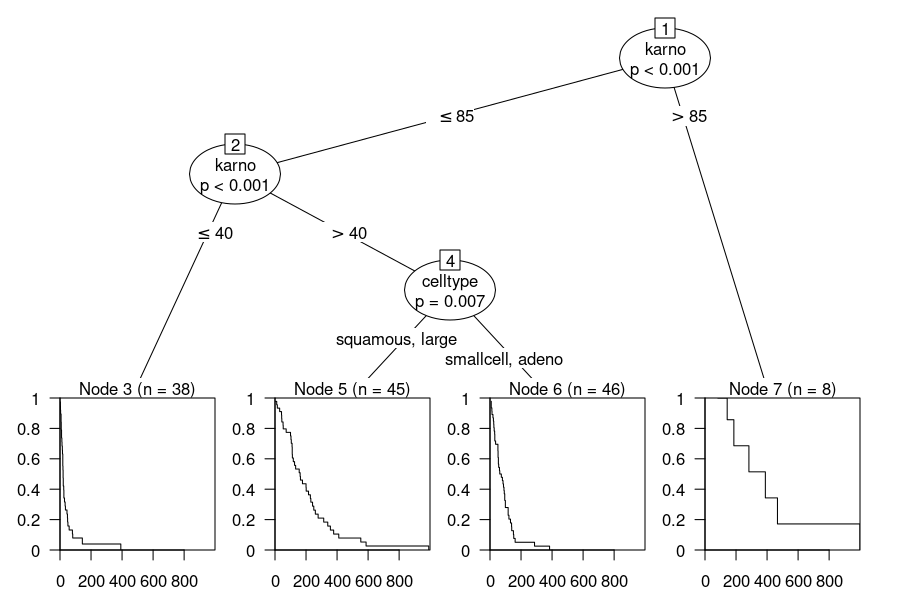
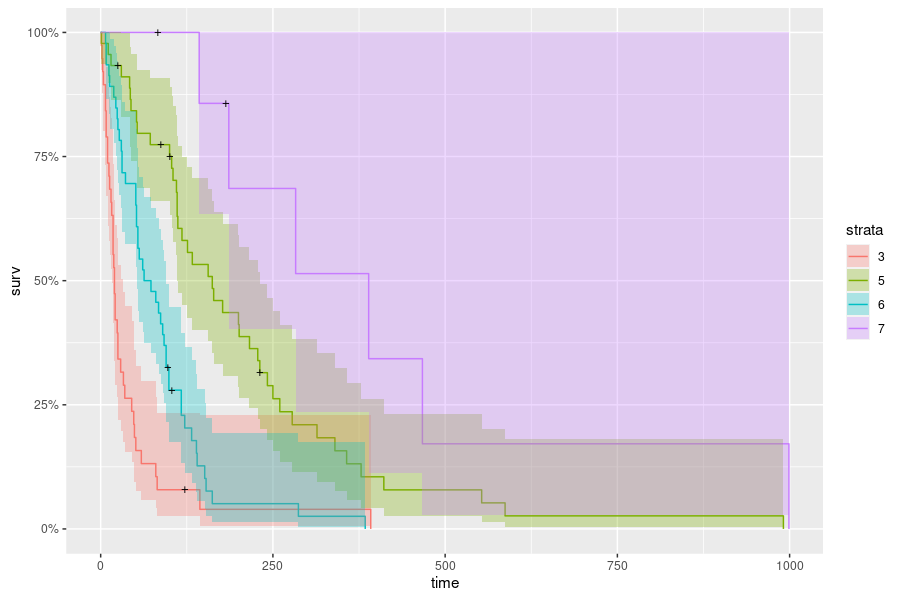
Question: Does what I have done make sense? Or was this completely unnecessary and it would have been better to just use a Survival Decision Tree (e.g. https://www.jstatsoft.org/article/view/v083i12/v83i12.pdf)? In general, is it advisable to identify sub-populations (i.e. cohorts) within the data using decision trees, and fitting models to the observations belonging to each of these sub-populations (i.e. the terminal nodes)?
Thanks


