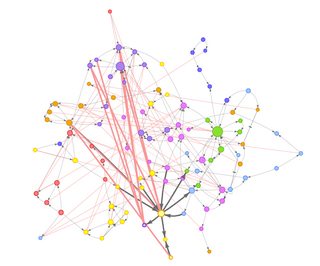
I'm having a network of belief system. It has ~100 nodes, 316 regular edges and 78 conflicting edges. (If belief B conflicts with belief A, then node B and node A share a conflicting edge. If belief B is a logical consequence of belief A, then node B and node A share a regular edge.) I think the best way to illustrate this graph is to have:
- nodes in the same community being closed together,
- nodes conflicting to each other being far away,
- conflicting edges that are almost parallel with each others being closed to give an idea of bundle
By "almost parallel" I mean if set S of closing nodes has many conflicting edges with set T of closing nodes, then the edges between them are almost parallel. The emphasized edges in this image illustrates that:

I ask a detailed question about this here: Is there a concept for "almost parallel" edge?
Is that a good way to visualize the network? If yes, then how should I set up the physics? I can do the first two points but I'm failed to do the third one. I'm using vis.js library, and it recommends the Barnes-Hut Algorithm. The above image is generated with this setting:
| Options | Value |
|---|---|
| gravitationalConstant | -10000 |
| centralGravity | 4.75 |
| springConstant (regular edges) | 0.205 |
| springLength (regular edges) | 95 |
| springConstant (conflicting edges) | 0.01 |
| springLength (conflicting edges) | 1000 |
