5
$\begingroup$

Interpreting what a (say) 95% confidence interval actually means is obviously tricky, especially when you are trying to teach it to students just beginning to learn stats.

One of the biggest challenges for me is that most definitions of confidence intervals actually use the concept of "confidence interval" as part of the interpretation itself. For example:

"Strictly speaking a 95% confidence interval means that if we were to take 100 different samples and compute a 95% confidence interval for each sample, then approximately 95 of the 100 confidence intervals will contain the true mean value."

I understand that this definition isn't viciously circular, but it's a nightmare to try to explain to students, who naturally wonder how we can define a confidence interval as telling us what will happen if we calculate a bunch of different confidence intervals.

Frequentism is what it is, and I know that we can't technically say that (e.g.) "there is a 95% probability that the true mean lies within the bounds of the 95% CIs," but I'm wondering if there is any way to accurately define what a frequentist confidence interval means that doesn't itself refer to confidence intervals.

Based on my understanding of frequentism, I think I have an idea for such an interpretation, but I'm not at all sure it is correct.

Let's say that we are trying to estimate the population mean $\mu$ of some variable Y. We draw a random sample of N observations, and from that sample we estimate a mean $\hat \mu$ and a standard deviation $\hat \sigma$. Using the $\hat \sigma$ and N we calculate a standard error and then use that to calculate a 95% confidence bounds of A and B.

My proposed interpretation of these values is: if it were true that the true mean of Y were the $\hat \mu$ we actually estimated, and we replicated our study a 100 times, estimating the mean of Y each time, then 95% of those estimates of $\mu$ would fall between A and B.

This is clearly different from how CI's are usually defined, but based on my understanding of frequentism, sampling error, and the central limit theorem, I feel like this is a valid (and potentially more intuitive) interpretation. It is based on a conditional, but since that's something we do when interpreting p values ("if the null hypothesis were true...") it's a concept that students encounter elsewhere in statistics, and I feel it might be less confusing than the apparently circular definition used in most textbooks....assuming it's statistically accurate.

So two questions:

  1. Is this a statistically valid interpretation of what a confidence interval means?
  2. Does anyone know any other interpretation of confidence intervals that don't themselves refer to confidence intervals?

Edit: It seems the answer to #1 is "no" (although it would be great if someone could explain why that interpretation is incorrect). I also realize I should clarify that for #2, what I'm really interested is in an intuitive interpretation of what a particular, estimated CI range means (i.e. to fill in the blank in the following sentence: "I have calculated a 95% CI around an estimate that ranges from A to B, this means that __________ between A and B") that doesn't itself refer to the concepts of "confidence" or "the process of calculating confidence intervals."

$\endgroup$
14
  • 8
    $\begingroup$ As I remarked in a comment earlier today, your proposed interpretation is incorrect (in several ways, too many to detail here). Have you studied our highest voted posts on CIs? Your basic problem seems to come down to terminology; namely, by not giving a confidence interval procedure and a confidence interval clearly distinct names, you risk confusion. That doesn't call for a different interpretation: the resolution would lie in the writing, not the concepts. $\endgroup$
    – whuber
    Commented Dec 30, 2021 at 18:50
  • 3
    $\begingroup$ BTW, in a search for related posts I came across a comment buried deep in a thread (and so is likely to be overlooked by everyone). The commenter expresses a liking for an explanation of the form "The [intervals] computed for 95% of all [possible] samples ... will cover the true [parameter value]." Although this lacks technical detail, it captures the concept neatly--and uses the word "confidence" nowhere. $\endgroup$
    – whuber
    Commented Dec 30, 2021 at 19:13
  • 3
    $\begingroup$ I believe the best definitions do clearly distinguish a CI procedure from its result. They provide an active way (in the grammatical sense) to describe what the statistician is offering to their client. I don't grasp your objection to the use of the term "interval" in describing a CI, but if you don't like it you can either define it beforehand or choose a different name! (The concept of an interval "covering" an unknown parameter value is so helpful here that it can be useful to explain that to prepare for stating your definition.) $\endgroup$
    – whuber
    Commented Dec 30, 2021 at 19:20
  • 3
    $\begingroup$ "this means that, while the true mean may or may not lie between A and B, the fact that the CI was produced by a process that generates correct intervals 95% of the time gives me some assurance." $\endgroup$ Commented Dec 30, 2021 at 20:12
  • 3
    $\begingroup$ I'd say that the thing in quotes in the third paragraph is not quite the definition of a confidence interval but an explanation of what the coverage property of an interval is. Implicit there is that we have a procedure for constructing intervals. In any case we can certainly talk about these things in stages, such as start with the concept of an interval for a parameter, and then the coverage of such an interval (when it pertains), and then define a confidence interval. (It's convenient to introduce the idea of a pivotal quantity when doing so.) $\endgroup$
    – Glen_b
    Commented Dec 31, 2021 at 4:35

3 Answers 3

1
$\begingroup$

Does anyone know any other interpretation of confidence intervals that don't themselves refer to confidence intervals?

...what I'm really interested is in an intuitive interpretation of what a particular, estimated CI range means (i.e. to fill in the blank in the following sentence: "I have calculated a 95% CI around an estimate that ranges from A to B, this means that __________ between A and B")...

Alas, not for the specific endpoints A and B that you've actually calculated for a specific CI. However, for intro students, we usually stick to CIs of the form $\hat\theta \pm \hat{MOE}$. So in the case of estimating a proportion $p$ from iid data, you could get something close to your wish by focusing on the margin of error (MOE) as the primary thing, and the CI as just a corollary of observing $\hat{p}$ and calculating the MOE.

We know that calculating MOE based on assuming $p=0.5$ gives a fixed conservative MOE for any $p$ (at the given sample size). This MOE is fixed and known (although conservative), $p$ is fixed but unknown, and $\hat p$ is treated as random but observed. So you really can say:

  • In 95% of iid samples of size $n$, (random) $\hat{p}$ will fall no more than (fixed) MOE away from $p$.
  • In this sense, we are 95% confident that $\hat{p}$ is no more than MOE away from the true $p$.
  • So this is the sense in which we are 95% confident that the interval $\hat{p}\pm MOE$ covers $p$.

Is that closer to what you want? It's not a clean direct statement about the observed endpoints (your $A$ and $B$), but it is clean and direct about the MOE.

For a somewhat-plausible scenario, tell the students to imagine they have iid data from a new political poll, in a election that looked neck-and-neck in the last poll. You're trying to estimate the proportion of voters who support candidate A and you have good reason to believe $p_A \approx 0.5$ before looking at the newest polling data, so the MOE assuming $p=0.5$ is conservative but not unreasonably so.

After building up intuition in this case where MOE can legitimately be known, you can move on to other situations where MOE isn't known and we only get an estimated $\hat{MOE}$.

  • We cannot say that 95% of (random) $\hat\theta$s will be no more than a (fixed) $\hat{MOE}$ distance from $\theta$.
  • But we can say that in 95% of samples, the random $(\hat\theta, \hat{MOE})$ pairs will be such that $\hat\theta$ is no more than $\hat{MOE}$ away from $\theta$.
  • So this is the sense in which we are 95% confident that the interval $\hat{\theta}\pm \hat{MOE}$ covers $\theta$.
$\endgroup$
0
$\begingroup$
  1. Does anyone know any other interpretation of confidence intervals that don't themselves refer to confidence intervals?

I like to interpret $\alpha \%$-confidence intervals as the range of the parameter values for which the significance is less strong than the $1-\alpha \%$ significance level (ie. the confidence interval contains the parameter values that are not falsified by the data).

Related questions

My proposed interpretation of these values is: if it were true that the true mean of $Y$ were the $\hat{\mu}$ we actually estimated, and we replicated our study a 100 times, estimating the mean of $Y$ each time, then 95% of those estimates of $\mu$ would fall between $A$ and $B$.

...

Is this a statistically valid interpretation of what a confidence interval means?

It is only approximately valid. In particular when the sample distribution as function of the parameter is a simple shift/translation of the distribution, and when the distribution is symmetric.

If this is not the case then the approach is not valid or at least inaccurate. Compare for instance the difference between a Wald interval and a Wilson score interval for estimating the confidence interval of a binomial proportion.

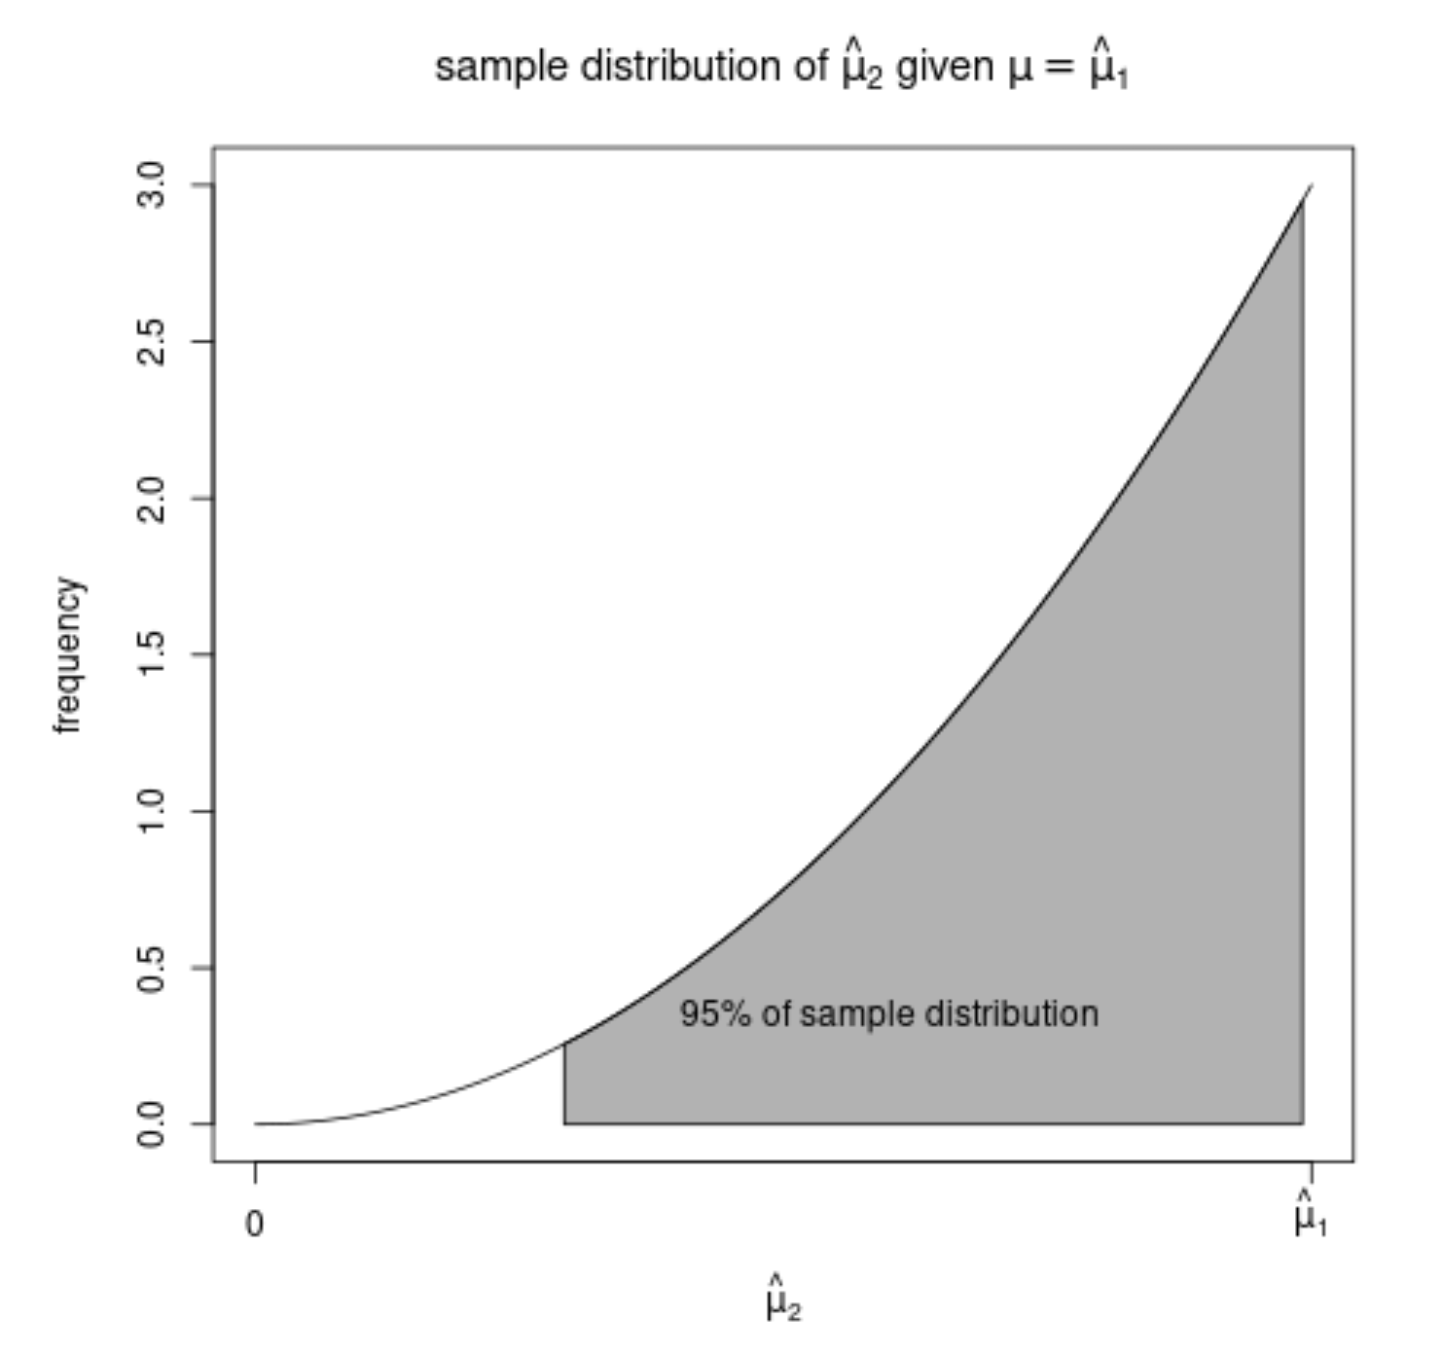
Another sample example is the German tank problem, the estimation of the maximum of a uniform distribution $X \sim U(0,\theta)$. Say you observed/estimated $\hat{\theta}_{1}$, then given $\theta = \hat{\theta}$ the sample distribution of a different new estimate $\hat{\theta}_{1}$ will be beta binomial distributed, like below, for a sample of size 3:

example

The estimate of $\hat{\theta}_1$ will be outside the confidence interval!

Related:

$\endgroup$
-1
$\begingroup$

One exponential observation. Suppose you buy an electronic device that is advertised to have an exponential lifetime averaging 60 months (5 years). It turns out that yours dies at two months. You would feel cheated.

In statistical terminology you might test $H_0: \mu = 60$ against $H_a: \mu < 60.$ You could reject $H_9$ at the 5% level. If $X\sim\mathsf{Exp}(\mathrm{rate}=1/60),$ then $P(X \le 2) = 0.033.$ [Using R:]

pexp(2, 1/60)
[1] 0.0327839

Without the jargon of hypothesis testing, you might say that if the true average lifetime were 60 months, then the 'probability' of such a short lifetime for your device is $0.033,$ which is unreasonably small.

Alternatively, you might say that you had 'confidence' that the device would last longer than two months. In ordinary English, there isn't much difference between the words probability and confidence.

If you knew about the frequentist definition of probability, you might say, "If $\mu=60,$ then only three or four people out of 100 would have such bad fortune." But you might choose to dwell mainly on your own situation, without reference to an imaginary group of 100 other people.

Of course, there is no way for you to know the true mean lifetime for sure, but you could reasonably feel that it's not actually 60 months.

Random sample from an exponential population. Now suppose that ten people buy this device and that their average failure times were $\bar X_{10}.$ Then one has the relationship

$$\frac{\bar X_{10}}{\mu} \sim \mathsf{Gamma}(\mathsf{shape}=10, \mathsf{rate}=10),$$

which can be 'pivoted' to give the probability statement $$P\left(\frac{\bar X}{U} \le \mu \le \frac{\bar X}{L}\right) = 0.95,$$ where $L$ and $U$ cut probability $0.025$ from the lower and upper tails, respectively, of $\mathsf{Gamma}(10,10).$

For example. if a random sample of size ten from an exponential population has $\bar X_{10} = 22.3,$ then a 95% 'confidence' interval for $\mu$ is $(13.1, 40.5).$

22.3/qgamma(c(.975,.025), 10, 10)
[1] 13.05254 46.50301

As long as we have no data at hand or we do not know the true value of $\mu,$ the displayed equation is a straightforward probability statement. But as soon as you have data, some people begin to fret that depending on $\bar X$ and $\mu$ the statement between parentheses (in the display above) is either true or false. To make peace with such people, there seems to be an agreement that it is OK to use the word 'confidence' for that expression, but to avoid the word 'probability'.

Somehow, these people feel that the 'probability' has collapsed to become meaningless. Never mind that the true value of $\mu$ will never be precisely revealed in any practical situation.

I feel that exactly the same quibble might be made concerning the probability statement earlier $P(X \le 2) = P(X\le 2\,|\,\mu)$ about your purchase of one electronic device. But somehow, that probability statement gets a free pass, possibly because we have previously speculated about a value of $\mu.$ So we don't need to call that a 'confidence' statement.

What to tell students and clients? It's OK to say, "There's 95% probability/ chance/ confidence that this random interval includes the unknown true value of $\mu."$ But in writing, your life will be simpler if you use the customary (diplomatic) word confidence. [Sometimes, even that is not enough to avoid controversy. There are contradictor and deeply-held views about the meaning(s) of frequentist confidence intervals. (See comments.)]


Notes:(1) In a Bayesian context, a prior distribution along with the likelihood function of data lead to a posterior probability distribution from which a Bayesian 'probability' or 'credible' interval is determined. Then quibbles about the applicability of the interval estimate to the current investigation disappear.

(2) The German philosopher Schopenhauer once said, "Philosophy is the systematic abuse of a terminology established just for that purpose." [my translation]. The quibble about the use of words 'probability' and 'confidence' may put frequentist statistical inference in a similar position.

$\endgroup$
6
  • 1
    $\begingroup$ "There's 95% probability/ chance/ confidence that this random interval includes the unknown true value of μ." I don't think that is true. Jaynes' paper on the subject gives an example where we can be 100% sure that the true value does not lie in a correctly constructed (if sub-optimal) confidence interval. $\endgroup$ Commented Dec 31, 2021 at 6:44
  • $\begingroup$ I would say such a CI would have to be much more "sub-optimal" than "properly constructed," whatever the technical definitions of those phrases may be. // Can you give a specific citation for this paper? $\endgroup$
    – BruceET
    Commented Dec 31, 2021 at 7:15
  • $\begingroup$ the citation is given here stats.stackexchange.com/questions/2356/… There is also a discussion of why the probability that the true value is not in the CI with the specified probability here stats.stackexchange.com/questions/26450/… with a worked example from David Mackay's book. $\endgroup$ Commented Dec 31, 2021 at 7:30
  • $\begingroup$ In both cases they are valid confidence intervals in the sense that the required proportion of intervals so constructed would contain the true value. $\endgroup$ Commented Dec 31, 2021 at 7:34
  • $\begingroup$ both links are explanations of the difference between Bayesian and frequentist intervals. They answer different questions, and it is "muddling" the two that causes problems. $\endgroup$ Commented Dec 31, 2021 at 7:52

Your Answer

By clicking “Post Your Answer”, you agree to our terms of service and acknowledge you have read our privacy policy.

Not the answer you're looking for? Browse other questions tagged or ask your own question.