1
$\begingroup$

Consider a $\chi^2$ test of independence of two categorical variables. In the test statistic, we have elements of the form $$ \frac{(\text{observed}_i-\text{expected}_i)^2}{\text{expected}_i}, $$ or $\frac{(O_i-E_i)^2}{E_i}$ for short. Here, $O_i$ is the observed value of a cell $i$ in a table, and $E_i$ is the corresponding expected value given the null hypothesis of independence. Under $H_0$, $O_i$ should be close to $E_i$ in most of random samples from the population. A large squared difference (scaled by $E_i$ in the denominator) suggests $H_0$ is unlikely to be true.

This is all fine, but $E_i$ in the formula is estimated from the sample rather than being the true expected value. What if $E_i$ happens to be far from the true expected value? Is this a problem?

$\endgroup$
5
  • $\begingroup$ Using a fit to determine $E_i$ does play a role in the degrees of freedom. $\endgroup$ Commented Jan 9, 2022 at 16:17
  • $\begingroup$ @SextusEmpiricus, could you spell that out in a bit more detail? $\endgroup$ Commented Jan 9, 2022 at 16:21
  • $\begingroup$ If you would read my explanation of the chi-squared test and its theoretical basis at stats.stackexchange.com/a/17148/919, then this question would not arise. $\endgroup$
    – whuber
    Commented Jan 9, 2022 at 19:28
  • $\begingroup$ You have $2n$ observations but will consider a chi-squared distribution with $n-1$ degrees of freedom (if n>1). $\endgroup$ Commented Jan 9, 2022 at 19:56
  • $\begingroup$ @whuber, the answer you suggested is an interesting read but I do not quite see how it addresses my question. (Perhaps I need to re-read it to find out?) $\endgroup$ Commented Jan 10, 2022 at 7:17

2 Answers 2

1
$\begingroup$

In short: 1 Roughly speaking you can see the distribution of $O_i - E_i$ as independent from the distribution of $E_i$. So if $E_i$ is a lot different from the true value does not matter so much for $O_i - E_i$. 2 The role of the $E_i$ in the denominator will be small if the observed numbers are sufficiently high.


Lets for simplicity consider the case where we only have 2 categories

$$\begin{array}{c|cc} & \text{category 1} & \text{category 2} \\ \hline \text{variable 1} &O_{11} & O_{12} \\ \text{variable 2}& O_{21} & O_{22} \\ \end{array} $$

and we fix the number of observations to $n$. Then due to the dependency we have basically only two observations. This simplifies the case because we can view it 2d and plot it.

$$\begin{array}{c|cc} & \text{category 1} & \text{category 2} \\ \hline \text{variable 1} &x & n-x \\ \text{variable 2}& y & n-y \\ \end{array}$$

Let's consider $n = 100$ and the hypothetical true categorical distribution has a fifty-fifty distribution for both categories.

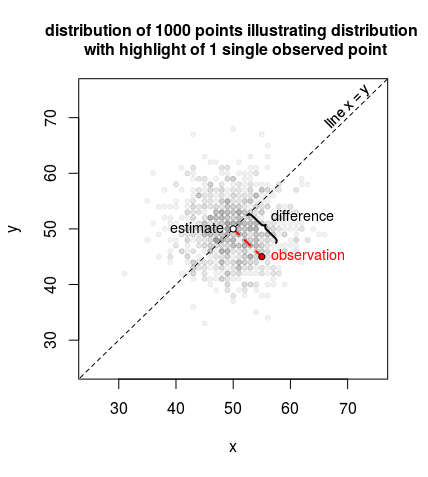
Then $x$ and $y$ (and the related $O_{ij}$) will be binomially distributed, but they can also be approximated as a normal distribution. Below a distribution is sketched by showing a sample of 1000 points
example

In the image, we also show how we can intuitively view the computation of the $\chi^2$ statistic. It can be based on the residual vector of the model which projects the observation $x,y$ onto the point $\beta,\beta$, on the diagonal line (with $\beta = (x+y)/2$). Where the length of this line is

$$d = \sqrt{\left( x-\beta \right)^2 + \left( y-\beta \right)^2 }$$

and $\beta$ is

$$\beta = \frac{x+y}{2}$$

We can relate this $\beta$ and $d$ to the following

  • approximately normal and independent distributed variables with

    $$\begin{array}{} d & \sim & N(\mu = 0,&\sigma^2 = 0.5 n) \\ \beta & \sim & N(\mu = n/2,& \sigma^2 = 0.5 n) \end{array}$$

  • the $\chi^2$ statistics equal to:

    $$\begin{array}{} \chi^2 &=& \frac{(O_{11}-E_{11})^2}{E_{11}} + \frac{(O_{12}-E_{12})^2}{E_{12}} + \frac{(O_{21}-E_{21})^2}{E_{21}} + \frac{(O_{22}-E_{22})^2}{E_{22}} \\ &=& \frac{(x-\beta)^2}{\beta} + \frac{(y-\beta)^2}{n-\beta} + \frac{(x-\beta)^2}{\beta} + \frac{(y-\beta)^2}{n-\beta} \\ &=& \frac{\frac{1}{2} d^2}{\beta} + \frac{\frac{1}{2} d^2}{n-\beta} + \frac{\frac{1}{2} d^2}{\beta} + \frac{\frac{1}{2} d^2}{n-\beta} \qquad \text{using $\beta^\prime = \beta-0.5n$} \\ &= &\frac{d^2}{(0.5n-\beta^\prime)(0.5n+\beta^\prime)} \\ & \approx& \frac{d^2}{(0.5 n)^2} \end{array}$$

What if $E_i$ happens to be far from the true expected value?

So in the view of the $\chi^2$ statistic approaching the chi-squared distribution as the above-explained approximation we see the influence of $E_i$ disappear in two points.

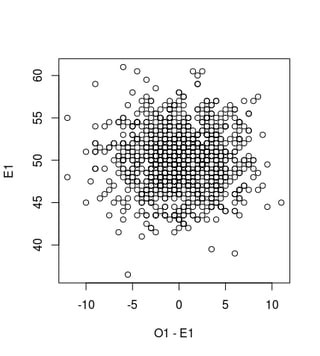
  1. The error terms in the numerator $(O_i - E_i)^2$ are like the residuals, and independently$^1$ distributed from the estimate $E_i$.
  2. The expression of $E_i$ in the denominator has only a very small influence if the numbers are high. The numbers $E_i$ may already have a small coefficient of determination (if the numbers are high), but also the increase of one $E_i$ is paired with the decrease of another $E_i$, and this dampens the effect on the chi-squared statistic even more.

1) an example/illustration of this independence is made with the following image and R-code
independence

set.seed(1)
O1 = rbinom(n,100,0.5)
O2 = rbinom(n,100,0.5)
E1 = 0.5*(O1+O2)
plot(O1-E1, E1)
$\endgroup$
5
  • $\begingroup$ Thank you, that is helpful. I wonder if your two points are sufficient by themselves, or is my point also needed to show that "this is not a problem" (w.r.t. the OP's question). My intuition was that my point was of first-order importance, but perhaps it is not? In other words, if the variance of the distribution of the difference between the true and the estimated $E_i$ did not shrink with the sample size and stayed as large as with $n=1$, would this be a problem? $\endgroup$ Commented Jan 10, 2022 at 7:10
  • $\begingroup$ I see mainly 2 points of which the 2nd relates to yours, but it is only in the denominator where it counts. So we have 1 The influence of $E_i$ is very small in the numerator term $E_i-O_i$ because of the (approximate) independence. This is independence is not because $E_i$ approaches a constant (law of large numbers) but instead because the observations approach a multivariate normal distribution (where the parameters like $O_1 - O_2$ and $O_1+ O_2$ are independent). 2 There is some influence of the parameter $E_i$ in the denominator. In that place you get that your point plays a role $\endgroup$ Commented Jan 10, 2022 at 7:15
  • $\begingroup$ You got deeper into the matter than I intended (and that is good). My original confusion concerned how presentations of $\chi^2$ test get away by saying $E_i$ is the expected value when it is actually only an estimate thereof, and then basing the intuition on how $O_i$ should not be far from the expected value under $H_0$. I remember being confused the first time I heard the argument, but I never got to think about it in any depth. When I remembered the issue 15 years later, it dawned on me that I now had some intuition as to why it works in spite of the discrepancy. (Why? Because it shrinks). $\endgroup$ Commented Jan 10, 2022 at 7:22
  • $\begingroup$ So my original concern did not go as far as to question whether $\frac{(\text{observed}_i-\text{expected}_i)^2}{\text{expected}_i}$ is actually $\chi^2$ distributed, it stopped earlier. In the meantime, your answer addresses a fuller point, I suppose. $\endgroup$ Commented Jan 10, 2022 at 7:26
  • $\begingroup$ @RichardHardy I remember that the first time that I came across the $\chi^2$ test I was wondering why it isn't (O-E)^2/O instead of (O-E)^2/E. It was only when I read Pearson's 1900 article that I came to view the $\chi^2$ test as an equivalent to a linear regression where we can have a geometrical view of the distribution of the observations as a n-dimensional cloud that partitions into two spaces with dimensions n-p and p. $\endgroup$ Commented Jan 10, 2022 at 7:45
0
$\begingroup$

No, it is generally not a problem. Consider the probability distribution of the difference between $E_i$ and the corresponding true value. The empirical $E_i$ converges to the corresponding true expected value fast enough (how fast: think Law of Large Numbers and Central Limit Theorem) so that the difference between the empirical and the true $E_i$ is asymptotically negligible compared with the difference between $O_i$ and $E_i$. Thus, the intuitive argument goes through despite $E_i$ being an estimate rather than the true value.

$\endgroup$
1
  • $\begingroup$ I added an answer that shows that there is more to it than just the $E_i$ converging to the true value. What we have in addition is that we can see this as $(E_i- O_i)^2$ as a variable that is independent of $E_i$. If $E_i$ is larger, then this is because $O_i$ (and some other values) are larger. The $E_i$ and $O_i$ are correlated. The result is that $(E_i- O_i)^2$ is nearly independent from $E_i$. $\endgroup$ Commented Jan 9, 2022 at 21:41

Your Answer

By clicking “Post Your Answer”, you agree to our terms of service and acknowledge you have read our privacy policy.

Not the answer you're looking for? Browse other questions tagged or ask your own question.