1
$\begingroup$

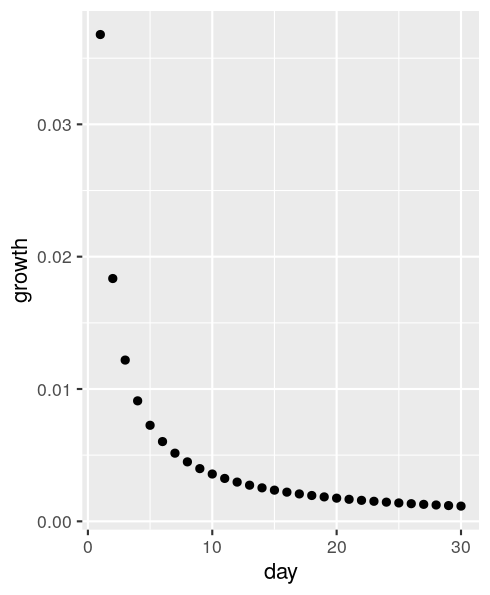
Example data with weibull decay for growth:

library(tidyverse)

# example weibull
example_df <- data.frame(
  day = 1:30,
  growth = dweibull(seq(1, 30, by = 1), shape = 0.1)
)

example_df |> ggplot(aes(x = day, y = growth)) + 
  geom_point()

enter image description here

Data looks like this:

example_df |> head()
  day      growth
1   1 0.036787944
2   2 0.018348802
3   3 0.012186100
4   4 0.009104847
5   5 0.007257658
6   6 0.006027639

Each day, growth decreases a little - a decay.

I would like to predict decay on a given day. Here's where I get confused.

Suppose I'm asked what decay is on day 20? Or day 25? How can I use a weibull regression to tell me? Tried something:

library(fitdistrplus)
fit.weibull <- fitdist(example_df$growth, distr = "weibull", method = "mle", lower = c(0, 0))

fit.weibull |> summary()
Fitting of the distribution ' weibull ' by maximum likelihood 
Parameters : 
         estimate Std. Error
shape 0.962954378         NA
scale 0.004707553         NA
Loglikelihood:  130.1494   AIC:  -256.2989   BIC:  -253.4965 
Correlation matrix:
[1] NA

This seems to fit a weibull curve to my data. But I also need to 'tell it' that growth is dependent on day.

I looked at survreg and survival packages but they want binary 1/0 data for survived/not survived. For my problem, I just want to associate day with growth using a weibull to be able to predict growth on a given day index.

How can I use a weibull to predict growth on a given day?

$\endgroup$
9
  • 1
    $\begingroup$ It is difficult to determine what your actual problem is because you seem to be confusing the formula for a Weibull density with a Weibull distribution. Could you please tell us, in non-technical terms, what your data mean and what you are trying to learn about them? $\endgroup$
    – whuber
    Commented Jan 14, 2022 at 17:49
  • $\begingroup$ Hi @whuber let me try here. We have an app and want to model revenue growth. Revenue grows by a decreasing amount each day, it looks similar to the plot I generated above. So, I would like to use a weibull regression model in order to predict growth on new installs. E.g. if 100 people install our app on monday and in total they spent $1K on day 1. How much revenue would they spend on day 2, day, 3, day 10, etc? Can I use a weibull in this way? Let me know if it's still unclear? I basically wnat to pass a data frame to a weibul regression with 2 fields: Growth Rate and Day $\endgroup$
    – Doug Fir
    Commented Jan 14, 2022 at 17:57
  • 1
    $\begingroup$ A graph that conforms to the formula for a Weibull density is not a Weibull regression model! You ought to back up quite a bit and consider what a reasonable form for the decay might be--exponential, power, something else. Then, by considering how data might vary, you can provisionally select a form of model that is suitable for their conditional variations. That raises a lot of questions, but I doubt any of them would be correctly answered by making your software work. $\endgroup$
    – whuber
    Commented Jan 14, 2022 at 18:00
  • 2
    $\begingroup$ You won't do it with fitdist! That's not performing a regression: it's estimating a (univariate) distribution function. You need software to perform nonlinear regression; but what kind of nonlinear regression and which software will depend on the conditional distribution you assume for the model. $\endgroup$
    – whuber
    Commented Jan 14, 2022 at 19:25
  • 1
    $\begingroup$ With some diffidence--because I suspect it isn't truly applicable for your data--I can refer you to the build-in nls function. Here on CV we have many worked examples of nonlinear regression, with R code. $\endgroup$
    – whuber
    Commented Jan 14, 2022 at 19:31

1 Answer 1

1
$\begingroup$

I think you are looking for something like this:

df <- structure(list(day = 1:6, 
                     growth = c(0.036787944, 0.018348802, 0.0121861, 0.009104847, 0.007257658, 0.006027639)), 
                class = "data.frame", row.names = c(NA, -6L))

#fit the model
model<-nls(growth ~ a*exp(-b*day), data=df, 
    start=list(a=1, b=0.1))

#Set up the prediction
test <- data.frame(day=1:10)
test$y<-predict(model, test)

#Plot
plot(df$day, df$growth, ylim=c(0, 0.04), xlim=c(0, 10))
lines(test$day, test$y, col="blue")

Here we are using the simple exponential decay formula $growth = a*e^{-b*day}$. If this fit is not satisfactory, then maybe try a polynomial or another function of your choosing.

$\endgroup$

Your Answer

By clicking “Post Your Answer”, you agree to our terms of service and acknowledge you have read our privacy policy.

Not the answer you're looking for? Browse other questions tagged or ask your own question.