1
$\begingroup$

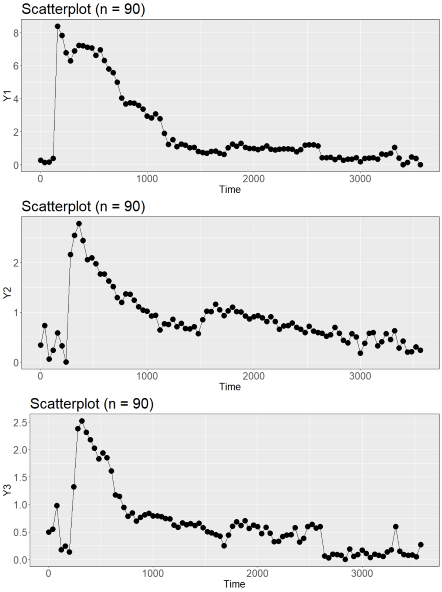
I recorded XY data from many individual cells responding to a stimulus (Concentration of Molecule A (Y-axis) ~ Time (X-axis)) (see image below for three such cells). How can I extract descriptive information from these XY curves (ideally using R)?

For example, I'm looking to determine (i) the amplitude of the response ('peak Y'); and (ii) the duration of the response (something like FWHM?). I'm also looking to 'combine' ~hundreds of curves from 'Group 1' vs. curves from 'Group 2' to determine if cells from Group 1 respond differently to the stimulus from cells in Group 2.

This may seem very simple but it's completely out of my field (I'm a biologist), and I haven't made much progress for two days. My question is similar to the following: https://www.researchgate.net/post/Suggestions_of_R_package_to_fit_calcium_transient_peaks_of_beating_cardiomyocytes.

Is there an R package to deal with these types of curves, and to extract useful descriptive information about them? (I've looked at a few packages, but looking for recommendations).

Thank you!

Calcium flux response

Data:

longDF <- data.frame(Time= c(0, 40, 80, 120, 160, 200, 240, 280, 320, 360, 400, 440, 480, 520, 560, 600, 640, 680, 720, 760, 800, 840, 880, 920, 960, 1000, 1040, 1080, 1120, 1160, 1200, 1240, 1280, 1320, 1360, 1400, 1440, 1480, 1520, 1560, 1600, 1640, 1680, 1720, 1760, 1800, 1840, 1880, 1920, 1960, 2000, 2040, 2080, 2120, 2160, 2200, 2240, 2280, 2320, 2360, 2400, 2440, 2480, 2520, 2560, 2600, 2640, 2680, 2720, 2760, 2800, 2840, 2880, 2920, 2960, 3000, 3040, 3080, 3120, 3160, 3200, 3240, 3280, 3320, 3360, 3400, 3440, 3480, 3520),
ID_10= c(0.87624083, 0.608154227, 1.12375917, 18.26456449, 33.7392664, 30.41636886, 27.23100229, 27.46212513, 29.40183853, 30.03372633, 29.81920771, 29.53997479, 28.49466959, 28.25494357, 27.61691052, 25.19996439, 23.66042909, 22.01356438, 18.81932835, 16.0563199, 15.43515305, 15.52913012, 15.19883875, 14.45480894, 13.11518851, 12.00413843, 12.30549103, 12.2197897, 9.762236749, 6.525986903, 5.719868948, 5.445130909, 4.872960777, 5.038618375, 4.598165101, 4.338570202, 3.856029628, 3.205085171, 3.008643458, 3.118131721, 3.367663486, 3.166971408, 2.780691744, 3.466905052, 4.757461565, 4.93883976, 5.019897328, 4.868860613, 4.212874301, 4.098932608, 3.985014938, 4.000544785, 4.438979657, 4.3028795, 3.819021014, 3.856056729, 3.979110985, 3.987474929, 3.915950683, 3.561988825, 3.553194446, 4.392047815, 4.976669425, 5.017803857, 4.894054946, 3.283617891, 1.773007163, 1.793239462, 1.585172752, 1.582282243, 1.478095983, 1.252920643, 1.39058861, 1.59759236, 1.264035982, 1.169222059, 1.663792832, 1.75956958, 1.586404706, 2.054234644, 2.636365373, 2.709235566, 3.608859077, 3.016326279, 0.856513748, 0.307278064, 1.26684957, 1.762772781, 0.792107842),
ID_16= c(1.568591404, 1.154441216, 0.431408596, 1.192387472, 1.318117519, 0.471416664, 3.135126406, 6.827536212, 7.731277141, 7.578749419, 6.522368203, 6.025090907, 5.912568401, 5.434066442, 5.12767617, 4.928821124, 4.568280212, 4.078291878, 3.616472432, 3.730440324, 3.968934817, 3.784386103, 3.42090476, 3.13080718, 2.99514339, 2.821910543, 2.711425644, 2.307866731, 2.057793061, 2.221720357, 2.348749777, 2.283102047, 2.162070786, 2.10836833, 1.954915127, 2.002025638, 1.858862199, 2.062383725, 2.711048268, 2.954033461, 3.166822855, 3.216634207, 2.876060115, 2.842336812, 3.089065657, 3.071732583, 2.934178239, 2.798367479, 2.598465053, 2.585133729, 2.67851297, 2.637784189, 2.469868439, 2.508011977, 2.504878037, 2.14029536, 2.010957926, 2.11546622, 2.206141402, 2.156686358, 1.975327265, 1.818197636, 1.900277037, 1.950836153, 1.771614559, 1.70206691, 1.585595743, 1.539448699, 1.801301277, 1.852513134, 1.472836816, 1.186582894, 1.387208411, 1.557499187, 0.98305758, 0.80842178, 1.391161504, 1.695664995, 1.33314633, 1.070443076, 1.418132894, 1.476428956, 1.569159421, 1.322533501, 1.014192751, 0.899916517, 0.593059559, 0.746641709, 0.792885524),
ID_22= c(0.279006891, 0.31862601, 1.720993109, 3.123295085, 2.938160227, 2.795044405, 2.933603198, 2.764989488, 2.571038388, 2.273987441, 2.09823741, 2.067399318, 1.938199879, 1.63540281, 1.63321373, 1.671526606, 1.258315716, 1.075636574, 1.191773382, 0.959022334, 0.762520598, 1.037258246, 0.977799596, 0.771623755, 0.626381428, 0.61478865, 0.730164781, 0.827204313, 0.857689084, 0.653317174, 0.754954944, 0.965540809, 0.790705702, 0.589458052, 0.811635517, 0.719934386, 0.304899709, 0.44832039, 0.46487004, 0.459692959, 0.786394149, 0.796923617, 0.812262399, 0.715507745, 0.585387113, 0.600241196, 0.572424038, 0.593786329, 0.576458001, 0.536957762, 0.605780927, 0.645730363, 0.563084632, 0.541792525, 0.47240884, 0.528895617, 0.558609196, 0.606275133, 0.713987433, 0.689543476, 0.565903231, 0.485826267, 0.586309046, 0.68789002, 0.564134324, 0.499044979, 0.482016564, 0.454654487, 0.363859684, 0.201658074, 0.254931076, 0.163516957, 0.266937582, 0.243803495, 0.026907709, 0.28940712, 0.435774591, 0.479568182, 0.547061148, 0.477665737, 0.49210496, 0.449504484, 0.34871838, 0.452518221, 0.506776085, 0.451481554, 0.344969305, 0.342471183, 0.431130754)
)
$\endgroup$
8
  • $\begingroup$ Can you post the data, I may have a solution. $\endgroup$
    – forecaster
    Commented Feb 12, 2022 at 17:14
  • $\begingroup$ Can I add data as an attachment?? $\endgroup$ Commented Feb 13, 2022 at 3:56
  • $\begingroup$ I don’t think so, since you have 90 observations, you can copy paste the data within the questionJust label Y1, Y2 and Y3 as columns with rows 1 thru 90 as observations. $\endgroup$
    – forecaster
    Commented Feb 13, 2022 at 8:39
  • $\begingroup$ It will take me few days, I can access the data now $\endgroup$
    – forecaster
    Commented Feb 13, 2022 at 16:10
  • $\begingroup$ Does the stimuli given at 5th datapoint for y1, 8th for Y2 and 7th datapoint for Y3 I.e, when we see first spike? $\endgroup$
    – forecaster
    Commented Feb 13, 2022 at 22:44

2 Answers 2

0
$\begingroup$

The question is what you consider to be a good notion of similarity between two such functions. If it suffices for them to have similar maximal values, then you should map each such curve to its maximum and then group (i.e. cluster) those maxima.

Chances are that the following approach might be appropriate for you: first reduce the amount of data by binning, i.e. partition your $x$-axis into $m$ fixed intervals $b_i$ (the bins), average the values of your function $f$ in each bin $b_i$ to $f^b_i$, thus obtaining a vector $f^b=(f^b_1, \ldots, f^b_m)$. This way you can create a coarser version of your original function by "smoothing" them out. And then you group your functions $f$ by clustering those vectors $f^b$. The dissimilarity between two functions $f, g$ is then given by the Euclidean distance $\|f^b-g^b\|$ between the belonging binned vectors.

Of course, your choice of the size of a bin is critical; the more bins you use the more details and peculiarities of your functions will be included in their dissimilarities.

R provides many clustering packages, e.g. dbscan.

$\endgroup$
5
  • $\begingroup$ Thanks frank. I will try to implement your approach manually, but it seems to me that (i) finding a peak and (ii) getting the amplitude and FWHM should be common enough that a package would do a much better job that I would do manually. I'm banging my head against the wall here.. any packages that can take a set of values (Concentration of Molecule A) and find a peak and describe its properties? I tried using dbscan to find a 'cluster' of points (the peak), but it didn't find anything, even with various eps values and minPts. $\endgroup$ Commented Feb 10, 2022 at 17:04
  • $\begingroup$ Note: it seems that dbscan is good for clustereing of 'weird' XY graphs with multiple clusters all over the graph area. But I'm struggling to use it to identify a peak in a simple time-series XY graph $\endgroup$ Commented Feb 10, 2022 at 17:24
  • $\begingroup$ @user3579613: So if you have two curves, both with the same max and FWHM but the first curve has it right at the beginning and the other at the very end, those would still be considered similar? $\endgroup$
    – frank
    Commented Feb 11, 2022 at 7:01
  • $\begingroup$ Ideally I would like to filter my curves and only analyze curves where the peak occurs at the beginning, to allow enough data points to the right of the curves for proper analysis. I'm currently using Skewness to filter for this. $\endgroup$ Commented Feb 13, 2022 at 16:06
  • $\begingroup$ @user3579613 Do you mean skewness of probability distributions? You can have two distributions, one with the bump on the very left and one with the bump on the very right, and still both having the same skewness. Moreover, if you mean skewness for probability distribution, you would need to normalize your curves first (the integral needs to be one). $\endgroup$
    – frank
    Commented Feb 13, 2022 at 16:20
0
$\begingroup$

If you don't have a theoretical form available for the expected change in signal over time, the best way to proceed is to let the data help tell you what that form is. There are several ways to do that, including local smoothers (loess), regression splines, smoothing splines, and generalized additive models (GAM).

A good general term to look for is "nonparametric regression." This page in the R Handbook and this Appendix to the textbook "An R Companion to Applied Regression" illustrate some of the approaches. You extract the information you want from the predicted smoothed curves rather than from the original data points. This answer shows an example of how to find peaks from loess-smoothed data. You could extend that approach to find the time values corresponding to one-half of the maximum on either side of the peak. I don't know of a package that will do that for you, however.

Before you do this, do look carefully at your data. Sometimes looking at all of your data can inform the best way to proceed. Blindly proceeding down a particular analysis path can lead to difficulties.

Example

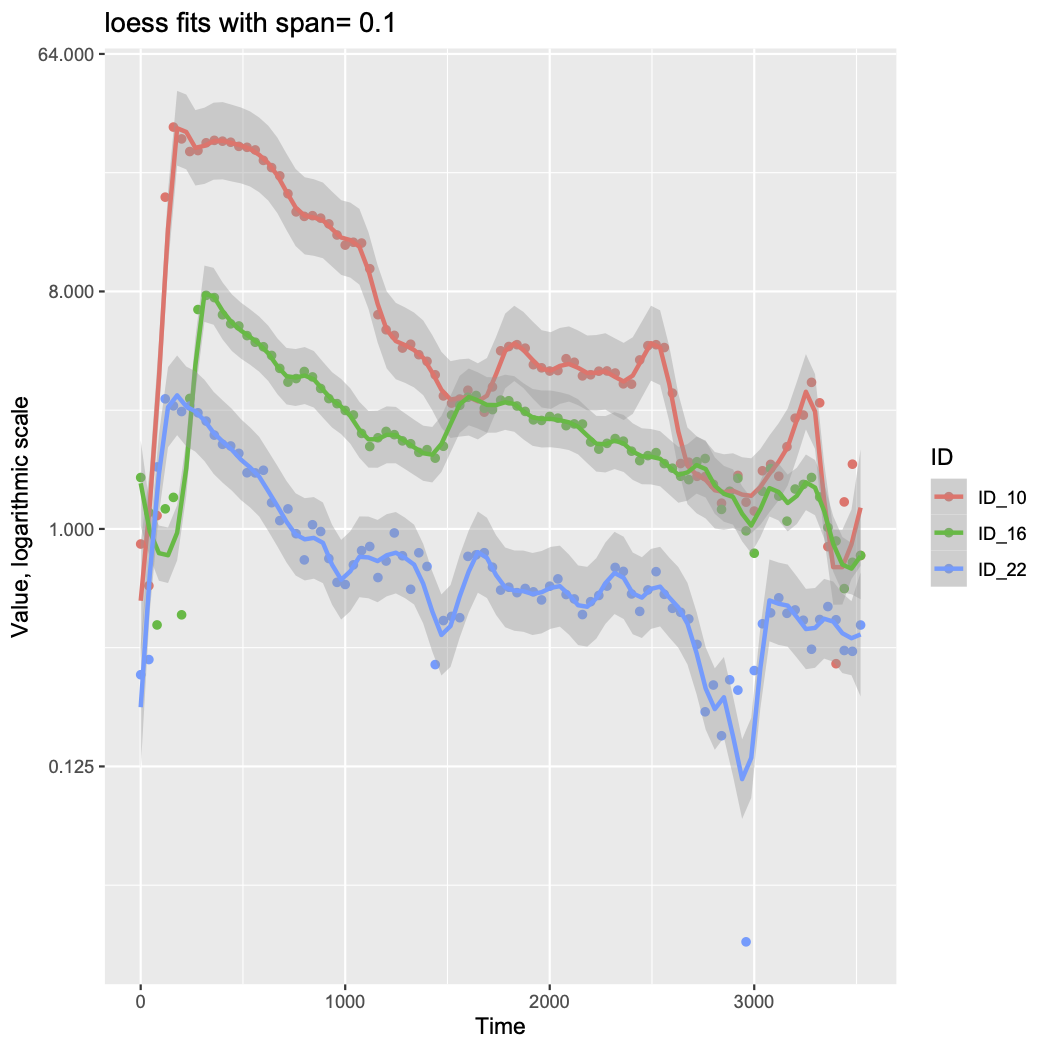
Look at the data first. Data like yours are often more informative with a log transform of the y-axis values. I reshaped your data to allow ggplot to show the points and loess fits for all 3 examples.

loess fits of data

It was critical to adjust the span setting, as the default value of 0.75 missed the sharp early peaks, particularly for ID_16. The plots suggest that you might be more interested in the time constant for what seems to be exponential decay for the first few hundred time units after the peak, rather than the full width at half maximum (FWHM). Nevertheless, here's how to get FWHM.

There might be a package somewhere that does what you want, but if you know the nature of your data then it's not too hard to write your own. The loess object isn't well explained in the help file, but it includes fitted values for each x along with the original x values. That, and the predict() function for a loess() fit, is basically all you need.

For data like yours that have a single well-defined peak in each case, you can write a function that (a) accepts a data set and the names of its x and y columns, (b) does the loess fit, (c) finds the fitted maximum y value and the corresponding x value, and (d) finds the difference between the x values at points where the fitted curve is 1/2 of the fitted maximum.

Here's some rough code, presented sort of in reverse order:

The first function is used to help find half-maximum times, based on a loess fit to log2 transformation of y values. It returns the absolute difference between the prediction at a given x value and one-half of the maximum (1 unit below maximum on a log2 scale).

diff_from_half<-function(x,fit){
    abs(predict(fit,x)-(max(fit$fitted)-1))
}

Use optimize() with the above function, on both sides of the peak, to return FWHM.

FWHM <- function(fit) {
    lowx <- optimize(diff_from_half,
    interval=c(0,fit$x[which.max(fit$fitted)]),
    fit=fit)$minimum; ## for x before peak
    highx <- optimize(diff_from_half,
    interval=c(fit$x[which.max(fit$fitted)],1000), ## 1000 is arbitrary, should choose intelligently
    fit=fit)$minimum; ## for x after peak
    highx-lowx ## return difference
}

Put those together with a loess fit to get the x value at the fitted peak, the fitted peak value (back in original scale), and FWHM.

getPeakFWHM <- function(x,y,data,span=0.1){## specify x and y column names as character
    loessfit <- loess(log2(data[,y])~data[,x],span=span); ## loess fit with log2 y
    maxLogy<-max(loessfit$fitted); ## find maximum y on log2 scale
    ttp<-loessfit$x[which.max(loessfit$fitted)]; ## x value at maximum y
    FWHM <- FWHM(loessfit); ## gets FWHM
    return(list(ttp=ttp,maxy=2^maxLogy,FWHM=FWHM)) ## returns values
}

Results with your data:

> getPeakFWHM("Time","ID_10",longDF)
$ttp
[1] 200

$maxy
[1] 35.68353

$FWHM
[1] 593.9492

> getPeakFWHM("Time","ID_16",longDF)
$ttp
[1] 320

$maxy
[1] 8.333531

$FWHM
[1] 529.0246

> getPeakFWHM("Time","ID_22",longDF)
$ttp
[1] 160

$maxy
[1] 3.271878

$FWHM
[1] 475.2396
$\endgroup$

Your Answer

By clicking “Post Your Answer”, you agree to our terms of service and acknowledge you have read our privacy policy.

Not the answer you're looking for? Browse other questions tagged or ask your own question.