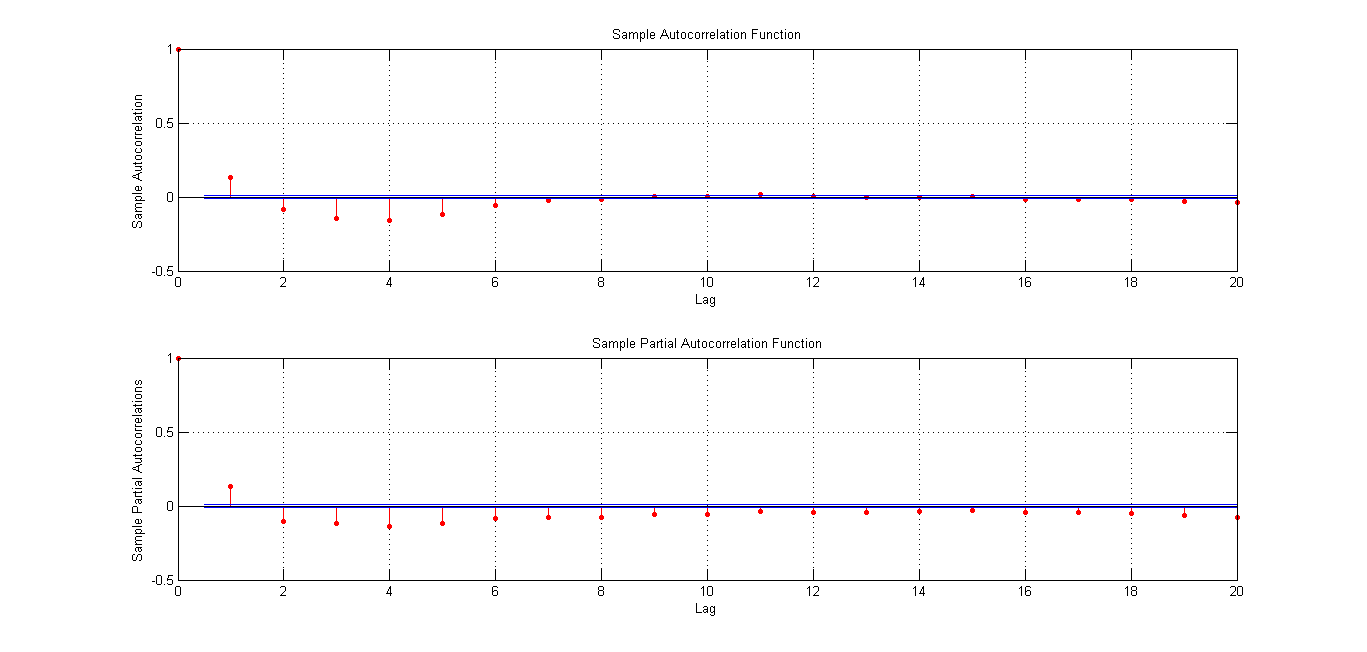
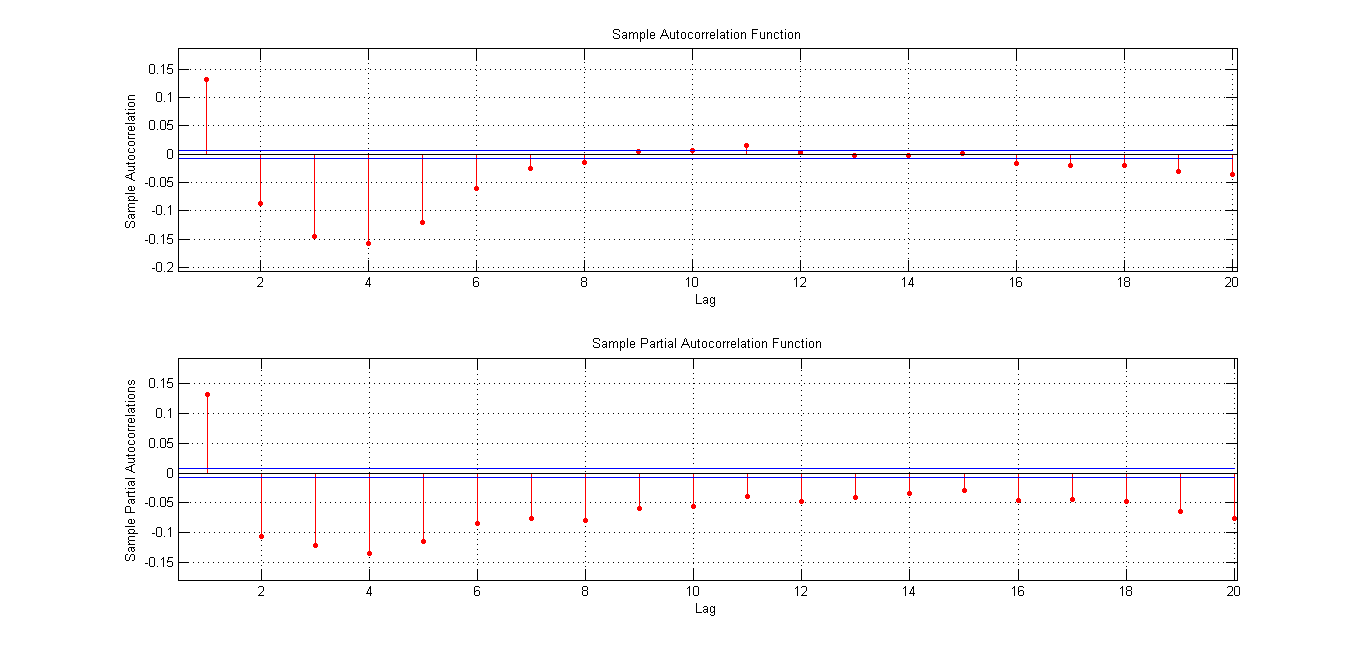
My ACF- and PACF plots are illustrated below:


The first one is in original scale and the second picture is zoomed. What process would you classify this? AR, MA or ARMA? =)
Thank you for any help =)
Neither displays any geometric decay nor any obvious orders from cut-off points, I would say ARMA. I would fit both an AR and MA and then inspect the acf/pacf of the residuals, maybe they would provide some insight. :-)
both acf and pacf graphs show slight seasonality but that cannot be clear untill we see the plot of original data,better to do both AR and MA and intrepret based on the results.