2
$\begingroup$

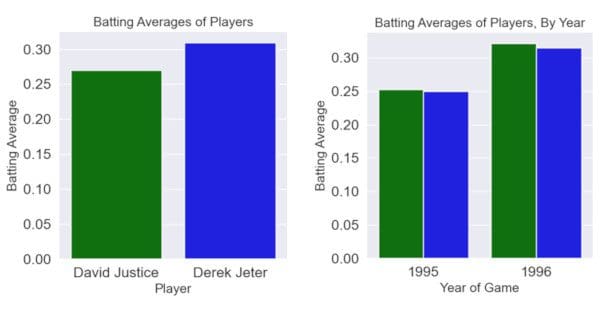
Sometimes continuous data is of the type that would result in Simpson's Paradox findings if groups were simply aggregated. (See, for example, "Example #2: Baseball" on this page https://www.kdnuggets.com/2020/09/simpsons-paradox.html.)

In that type of situation, would analyzing the data using a 2-way ANOVA always avoid the spurious finding? In the baseball example, would the paradox effect simply be seen as a year effect and the player effect would be correctly seen?

$\endgroup$

3 Answers 3

2
+25
$\begingroup$

Look at the image

1

The right image shows the main effects and the (tiny) cross effect, but it does not directly explain why the marginal distribution on the left is larger for Derek Jeter.

The reason that causes the paradox is that the average over the two years (on the left) is computed with different weights. Derek's good 1996 result counts relatively more strongly than David's good 1996 result because they did this with different amounts of bats.

One way that Simpson's paradox will be apparent is that adding a factor to the model can invert the direction of another effect. Without year as a factor, the effect of Derek vs David is positive. With year included in the model, the effect becomes negative. But, this doesn't make the two-way model immune to the paradox. You need to define this 'immune' carefully. Whether the two-way model is a good thing or not depends on whether you want to consider the extra parameter or not and whichever way is the rigt way to interpret the data, this depends on the context (Simpson's second paradox).

$\endgroup$
6
  • $\begingroup$ With respect to "immune", could you give an example of a 2 way ANOVA in which Simpson's paradox could be operating undetected? $\endgroup$
    – Joel W.
    Commented Apr 15, 2022 at 13:16
  • 1
    $\begingroup$ @JoelW. "Whether the two-way model is a good thing or not depends on whether you want to consider the extra parameter or not and whichever way is the rigt way to interpret the data, this depends on the context" With the one-way model Derek Jeter has the better batting average with the two-way model David Justice has the better batting average. The paradox is that there is a difference, but it doesn't judge which of the two models, one-way or two-way, is correct. So if you are using a two-way model, it doesn't mean that you avoided the paradox. $\endgroup$ Commented Apr 15, 2022 at 16:00
  • $\begingroup$ At least with a two way approach you are not tricked into an illogical conclusion. In that sense, it is immune. The conclusion you reach is not due to the operation of some mathematical quirk that is hidden from view or, at least, not recognized. $\endgroup$
    – Joel W.
    Commented Apr 15, 2022 at 18:43
  • $\begingroup$ @JoelW. The conclusion that Derek has a higher batting average than David is not illogical. I would say that the opposite conclusion is illogical. $\endgroup$ Commented Apr 15, 2022 at 19:02
  • $\begingroup$ In any case, with a two way approach you are not reaching a conclusion while oblivious to the Simpson's Paradox aspects of the data. $\endgroup$
    – Joel W.
    Commented Apr 18, 2022 at 19:21
1
$\begingroup$

Simpson's Paradox can be seen in patterns among categorical variables (contingency tables) or continuous/scalar variables (which graphically would involve scatter plots with groups denoted by color, and might be referred to as Lord's Paradox).

Your query taps into the idea of whether you can mix the types of variables. And, as Sextus Empiricus's answer indicates, the answer is yes...this is indeed possible.

However, the key to remember with Simpson's Paradox (and all the similar variations) is that the Paradox is a warning to explore the data more completely. My reading of Simpson's reflections on this (and others who have thought more deeply about this) is that the answer is always "maybe". On its own, it could be a player effect, a year effect, both or neither. The advantage to the 2-way ANOVA is that you have the interaction term. And while you could use the significance of these interaction to decide if there is or is not a scenario that leads to a possible example of Simpson's paradox, the underlying issue still remains...perhaps there is yet a 4th variable that explains the relationship in the dependent variable better than the currently available independent variables. (And, I believe this is what Simpson intended us to attend to when drawing conclusions from data.)

$\endgroup$
2
  • $\begingroup$ Could you give an example of a situation where there could be a 4th variable operating that could lead to an erroneous conclusion of the type Simpson identified? $\endgroup$
    – Joel W.
    Commented Apr 15, 2022 at 13:11
  • $\begingroup$ Hypothetically, it could be the case that there is a 4th variable home-advantage...but, if this is something that interacts with player and year, then this could be influencing the results. In other words, some players do better at home in one year than others, and the pattern might be reversed for a different group of players. This could obscure the presence of a true year effect. $\endgroup$
    – Gregg H
    Commented Apr 15, 2022 at 15:57
0
$\begingroup$

Here's the important thing to know: ANOVA is just a fancy way of saying "Doing an F-test on a linear regression."* (I would ban the word "ANOVA" if I could, to be honest.)

OK, so we can replace the word "ANOVA" with "Linear regression." The next thing to understand is that the linear regression is Simpson's "paradox." Simpson's paradox is just the observation that a linear regression coefficient** can be negative even if the total correlation in the population is positive, as long as the linear regression stratifies by (controls for) more than one variable.

Because of that, we can see that we don't want a methodology that's "immune" to Simpson's Paradox. If I add a control variable to a linear regression, I'm doing it because I want to know the partial correlation -- the correlation after adjusting for this variable -- not the total correlation. If you want the total correlation, calculate the total correlation, not an ANOVA or linear regression.

I'd suggest taking a look at Richard McElreath's book Statistical Rethinking; I think the more intuitive approach he takes there might be helpful.

*It's not, strictly speaking, necessary to calculate the linear regression out if all you're interested in is p-values. However, the numbers you calculate at the end are identical and the two procedures are mathematically equivalent.

**Or another kind of analysis.

$\endgroup$
4
  • $\begingroup$ "the observation that a linear regression coefficient** can be negative even if the population correlation is positive" What is 'the population correlation'? $\endgroup$ Commented Mar 28, 2022 at 8:33
  • $\begingroup$ ANOVA is not fancy. The term is almost a hundred years old. $\endgroup$ Commented Mar 28, 2022 at 8:36
  • $\begingroup$ You're right that ANOVA isn't fancy, and I'm not claiming it is. I'm saying it's just a much less intuitive way of doing a linear regression. Getting a student to understand linear regression takes 5 minutes. Getting a student to understand ANOVA is next to impossible. $\endgroup$ Commented Mar 28, 2022 at 17:19
  • $\begingroup$ By population correlation, I mean the naive correlation $E(XY) - E(X) E(Y)$ (not the partial correlation after adjusting out some other variable). $\endgroup$ Commented Mar 28, 2022 at 17:20

Your Answer

By clicking “Post Your Answer”, you agree to our terms of service and acknowledge you have read our privacy policy.

Not the answer you're looking for? Browse other questions tagged or ask your own question.