2
$\begingroup$

I am trying to evaluate the effect of wind direction (circular variable) on a dependent linear variable. I have used circular-linear regression to find the correlation coefficient between the two variables, shown in the code sample below.

import numpy as np
import pandas as pd
import scipy as sp
from scipy import stats

data = pd.read_csv('Data_example.csv')

x = data.Rate # dependent linear variable
theta = data.WindDir_deg * (3.14159265359/180) # corresponding measured wind directions (converted to radians)

rxc = np.array(sp.stats.pearsonr(x,np.cos(theta)))
rxs = np.array(sp.stats.pearsonr(x,np.sin(theta)))
rcs = np.array(sp.stats.pearsonr(np.cos(theta),np.sin(theta)))

rho = np.sqrt(((rxc)**2 + (rxs)**2 - (rxc)*(rxs)*(rcs)) / (1 - (rcs)**2))

print("Correlation coefficient, ", rho)

Example Data

     Rate       WindDir_deg
0   -0.102186   180
1   -0.051093   200
2   -0.026898   40
3   -0.012773   180
4   -0.004927   0
5   -0.002488   50
6   0.000000    180
7   0.000000    160
8   0.000000    180
9   0.018639    170
10  0.019800    320
11  0.021236    160
12  0.025028    20
13  0.026400    240
14  0.030280    160
15  0.033402    150
16  0.037174    190
17  0.040175    180
18  0.041331    160
19  0.049942    190
20  0.051093    120
21  0.052635    140
22  0.052800    360
23  0.057955    170
24  0.057955    170
25  0.057955    30
26  0.059413    330
27  0.060490    170
28  0.060560    20
29  0.063866    190
30  0.070678    170
31  0.072444    240
32  0.085714    160
33  0.101950    0
34  0.105600    0
35  0.110216    40
36  0.120980    180
37  0.121660    170
38  0.145200    10
39  0.173865    180
40  0.204372    180
41  0.242240    30
42  0.351462    180
43  0.360800    170
44  0.423920    30
45  0.592800    160
46  0.741000    190
47  1.937873    170

Now how do I estimate the actual wind direction that has the maximal effect on the linear variable? For example in the data shown in this plot, the wind direction with maximal effect on the linear variable appears to be somewhere between 150° and 200°, but how to I calculate this mathematically?

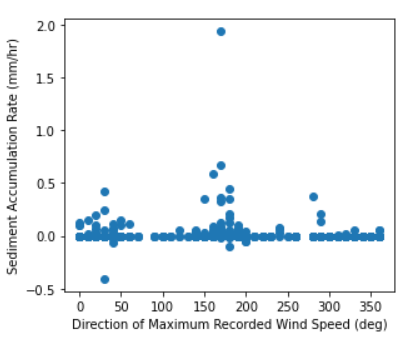
enter image description here

$\endgroup$
5
  • $\begingroup$ Isn't this a restatement of your previous question at stats.stackexchange.com/questions/568870/…? $\endgroup$
    – whuber
    Commented May 3, 2022 at 22:42
  • $\begingroup$ No not exactly. My previous question was asking how to quantify a relationship between the two variables, which I have now done by calculating the correlation coefficient (see code example). This new question is asking specifically how to estimate the actual value (degree direction) that has the maximal effect on the linear variable. $\endgroup$
    – L_Horner
    Commented May 3, 2022 at 22:56
  • 1
    $\begingroup$ Can you make your code reproducible, by making your dataset available? $\endgroup$ Commented May 4, 2022 at 16:15
  • $\begingroup$ Of course. I have edited my question to include a snippet of the dataset $\endgroup$
    – L_Horner
    Commented May 4, 2022 at 18:08
  • $\begingroup$ For future readers: I recommend horizontal axis labels 0(45)360 not 0(50)350. Text such as N NE ... NW may make more sense too. $\endgroup$
    – Nick Cox
    Commented Oct 2, 2023 at 9:47

2 Answers 2

4
$\begingroup$

This is a bundle of comments on the question: the graph alone requires answer form. Gratitude to the OP for posting their data to allow more analysis.

The principle of regressing on sine and cosine and using its results is good. In practice the data are too complicated and even contradictory to allow such a simple model to be successful or even helpful. (That regression is a routine calculation; suffice it to say that $R^2$ is $0.0172$, and so very disappointing.)

There are exact zeros and some negative values and a marked outlier in the outcome. I suspect that even quite experienced analysts may over-estimate the dependence on direction given sight of that outlier. An alternative is to work on a transformed scale. Here I use a cube root transformation.

Many readers will have met cube roots briefly and quite early in their mathematical education but may have had only occasional need to use them. At the risk of emphasising what is elementary or obvious: The cube root of a positive number is another positive number; the cube root of zero is zero; the cube root of a negative number is also a negative number (recall that the cube root of $-8$ is $-2$, for example). Hence cube roots preserve sign and pull in outliers in either tail. Readers wary of a cube root transformation as having too much ad hoc flavour are welcome to suggest an alternative (other than staying on the original scale, which is defensible, but needs caution).

Computational detail: Your software like mine may need that to be set up as $\text{sign}(y)\ |y|^{1/3}$, as calling up cube roots as specific powers may choke on an intermediate call to a logarithm routine given any negative arguments.

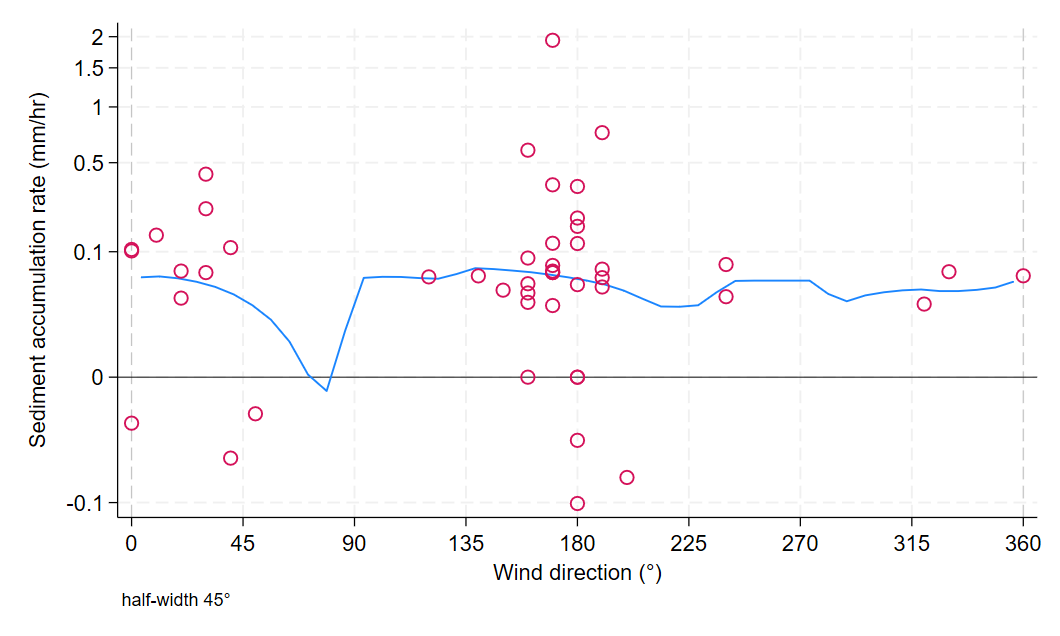
Here is a scatter plot of cube root of outcome versus direction with a biweight kernel smooth of half-width $45^\circ$. See e.g. here for more on that kernel and alternatives. The smoother unlike the graph looks around the corner, and so looks at outcomes with direction just West of North when the window has centre just East of North, and vice versa. A clear desideratum is that smooth for $0^\circ \equiv $ smooth for $360^\circ$, as these directions are one and the same. The smooth shows some kinks as an artefact of data points entering and leaving the window even though the kernel tapers to weight 0 at the ends of the window.

enter image description here

There are many geographical contexts in which wind direction can be bimodal, including location in a valley with up- and down-valley winds (anabatic and katabatic) or a coastal location with on-shore and off-shore winds.

I tried more complicated models than just one sine and one cosine term, but that was futile if not misguided.

My executive summary is that on these data the idea of a wind direction that maximises the outcome is unconvincing.

I used Stata: the only computational detail that could exercise readers is the need for a circular smoother that respects wrap-around at direction zero (here North, presumably; the need arises for any other choice of zero).

$\endgroup$
2
$\begingroup$

The circular-linear correlation coefficient is the square-root of the fraction of variance explained by a linear model

$$x = a \cos(\theta) + b \sin(\theta) + c$$

Fit this regression with least squares and obtain $(a,b)$. The direction where $x$ is the largest should then be $\tan^{-1}(b/a)$. Use arctan2(b,a) to calculate this. Alternatively, you can view $a + ib$ as a complex number, and recover the phase via np.angle(a+1j*b). (Incidentally, the magnitude $|a + ib|$ captures the depth of modulation and is vaguely analogous to slope in linear regression).

$\endgroup$
2
  • 1
    $\begingroup$ Why would this estimate the direction of "maximum effect", especially with a distribution that empirically looks multimodal? $\endgroup$
    – whuber
    Commented Feb 25, 2023 at 15:23
  • 1
    $\begingroup$ I think you're right. Things also get awkward when data are limited and $\theta$ isn't sampled uniformly. IMO the linear regression is clearer, but you need to be careful. If you want the best R² on your data, then you fit this with OLS, which will react to induced correlations in the sine and cosine of θ. But, if you want a "ground truth" estimate of best direction, we know that sine/cosine will be zero mean, uncorrelated, and have variance ½. IMO this is feels better in some sense, and the circular-linear correlation seems worryingly biased. $\endgroup$
    – MRule
    Commented Feb 26, 2023 at 18:21

Your Answer

By clicking “Post Your Answer”, you agree to our terms of service and acknowledge you have read our privacy policy.

Not the answer you're looking for? Browse other questions tagged or ask your own question.