I'm a junior engineer at a small biotech company and have some (real) data from a fractional factorial DoE (3 factors, 2 levels, 4 test conditions with six replicates each). Currently, we use excel to analyze this data, although I'm more familiar with Matlab and SAS.
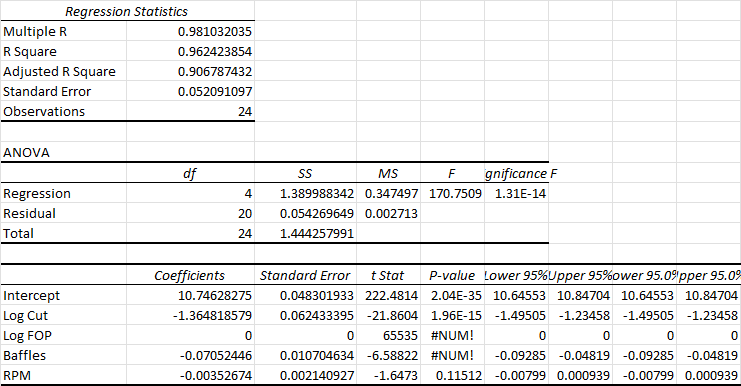
I'm trying to do a multiple linear regression with the data in excel, but the results are a little counter intuitive:
The main issue is that theoretically, I was expecting the relationship to mainly be of the form: Response=log(FOP)-log(Cut). Response is the log of a concentration diluted, and the cut is a dilution factor, so it's surprising that the concentration of the undiluted product has no effect on the response. Moreover, the intercept calculated here is very close to the average value of Log(FOP).
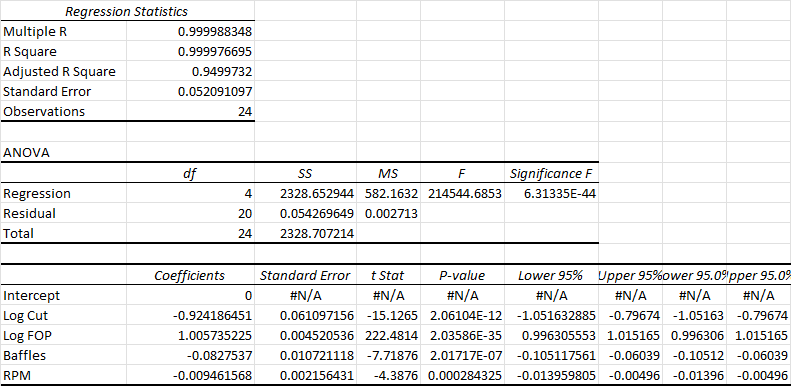
I reran the regression with the intercept set to zero and got these results:
Now things look closer to the theoretical expression, with some possibly useful information about the impact of other process variables. The problem is that the p-values seem suspiciously low, and the R-squared suspiciously high. Obviously forcing the intercept to be zero is not great, but is it normal for there to be such a big difference in the fitted coefficients?
Any guidance would be much appreciated.


