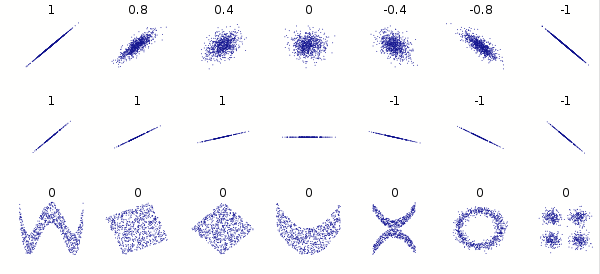
Wikipedia has this image showing different correlations:
It says:
The correlation reflects the noisiness and direction of a linear relationship (top row), but not the slope of that relationship (middle) … the figure in the center has a slope of 0 but in that case the correlation coefficient is undefined because the variance of Y is zero.
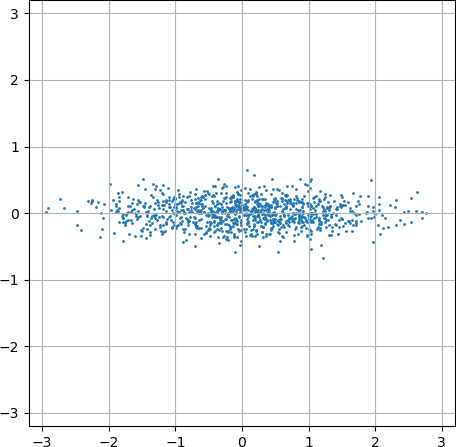
But if the variance of Y is not zero, but still different from that of X, such as in this image:
Does it still have the same value of correlation that it would have if rotated? It seems not, since the covariance goes to zero and that's the numerator of the correlation formula? (Since there are just as many positive $\operatorname{E}[X⋅Y]$ terms as there are negative.)
I'm confused about this paper which talks about the "correlation" of multivariate normal distributions, and says things like this:
To facilitate the large number of simulations involved, in each case rotation to principal axes was employed to diagonalize the correlation matrix (Morrison, 1976, ch. 8). This permits Monte Carlo generation of independent normal variates with variances equal to the eigenvalues of the correlation matrix.
…
(The correlation for this scatter plot is .5; the distribution has been rotated to principal axes.)
…
The correlation matrices used to produce this table assume that all off-diagonal correlations are the same (either all 0 or all .5).
Would it be possible to measure the correlation of such a distribution?
Similarly, this paper generates distributions like this:
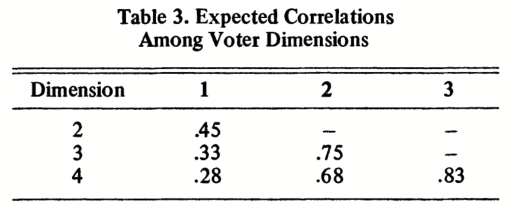
All voters are represented by their ideal points in a four-dimensional space, that is, by a four-tuple of real numbers. The four numbers are generated in the following way: voter i's position on the first dimension, Y1i, is chosen from a standard Gaussian (normal) distribution (mean zero, standard deviation 1.0). The voter's position on the second dimension Y2i, is generated from the first dimension position by perturbing it with Gaussian noise of mean zero and standard deviation 1.4. The third position is produced from the second with fresh noise of similar character, and the fourth is generated from the third in the same fashion.
But wouldn't this process create distributions shaped like above, with no slope and therefore no measurable correlation? Yet they show a correlation matrix where all the values are between 0 and 1:
They also say
The values on all dimensions are then normalized to have unit variance.
Which I would think would make the distribution completely symmetrical in every dimension and no longer even have this type of no-slope "correlation".
I'm confused.


