1
$\begingroup$

Background

I'm building a convolutional neural network (CNN) to predict the response factor (continuous variable) of organic molecules. As input, I use 86x86 onehot-encoded matrices that represent the compounds in my dataset. Since I do not have a huge dataset, I use 80/20 training/validation split, without a separate test set. Network architecture is similar to that of VGG and a similar architecture has been successfully deployed to deal with a very similar task as described here: https://doi.org/10.1021/acs.analchem.8b05821. Shortly, it consists of a series of 2D convolutional layers [3x3 filter size, stride 1, followed by ReLu and max pooling)], global pooling and several fully connected layers. MSE is used as loss function as a MATLAB default.

Problem at hand

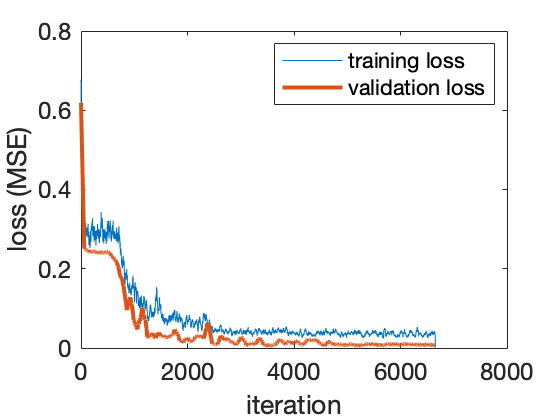
During training both training and validation losses decrease pretty much synchronously as shown in the figure: enter image description here
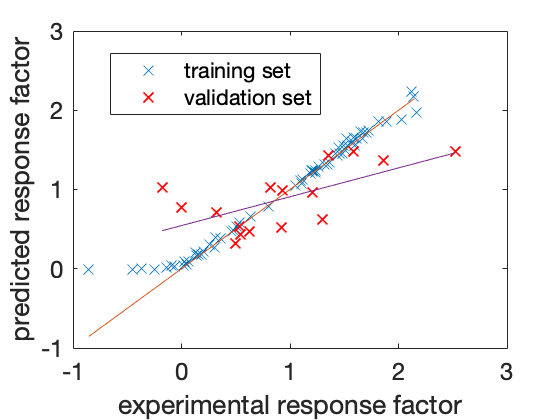
Seeing this, I believed the network would give very accurate predictions, however, there is a huge performance difference between training and validation sets as seen below:enter image description here
What has been done:

I've tried changing the configuration of the network by varying the number of convolutional and fully connected layers, applying dropout layers in front of a few fully connected layers (slightly helped), adding batch normalisation layers after convolutional layers (didn't help at all, it made performance even worse, surprisingly) and experimenting with different minibatch sizes and learning rates. It seems my network is very sensitive to initial learning rate since even minor changes can deteriorate the predictive performance. Repartitioning the dataset does not induce major changes in the shape of the loss curves or the predictive performance.

I believe I'm facing of some kind of overfitting, judging by the almost perfect predictions on the training set and worse performance on the validation set. However, in that case I'd expect the validation loss curve to take the "typical" U-shape, which doesn't happen in my case and makes me puzzled. I'm yet to give more tries to data augmentation, although the first experiments with that resulted in marginal improvement only.

Question

What can be the explanation to this odd behaviour? Why does my network perform so badly on my validation set while the loss is approximately the same as that of the training set?

$\endgroup$
4
  • $\begingroup$ Unrelated to the actual question, but why one would use one-hot encoded vectors, to represent the Smiles tokens. Could you not use an embedding layer? Secondly, I also think the choice of a 2d-convolution uncommon. usually for SMILES people rely on 1D Convolutions. Bc you want to capture the complete representation of the SMILES Token. $\endgroup$
    – Janosch
    Commented Jun 3, 2022 at 15:42
  • $\begingroup$ @Janosch do you mean a word embedding layer, such as the ones for text processing? That's something I initially considered as well although I haven't seen it in the literature. Also since I'm an absolute beginner in ML, I decided to go with onehot encoding the SMILES as it was easier to grasp for me. Ad2: my choice with 2D convolution came from image analysis, but now as you pointed it out, I very well might be wrong with it. While it may not help with the original question, I'm grateful for this point, now I have something to try $\endgroup$
    – DanPav22
    Commented Jun 3, 2022 at 17:20
  • $\begingroup$ Yes I think 1d convolution should be the better choice, I beleve. With regards to the "Word Embedding". It is not that complicated actually, you just multiply the one-hot encoded matrix with a weight matrix. The advantage of using embeddings is, that they can be learned. For example, the embeddings for an aromatic carbon should look more similar to an aromatic nitrogen, than to an oxygen after training. So the embeddings also helps to kinds of integrate relevant chemcial information into the representation of the SMILES tokens $\endgroup$
    – Janosch
    Commented Jun 7, 2022 at 7:12
  • $\begingroup$ @Janosch indeed it shall be 1D convolution, thanks for pointing it out. However, after some fine-tuning of training options and layer parameters I'm facing the same problem as in the post, which is still quite odd. $\endgroup$
    – DanPav22
    Commented Jun 10, 2022 at 13:10

1 Answer 1

0
$\begingroup$

As you get out past iteration $6000$, it seems like the train and test loss values are stable, as is the distance between them, which looks small. However, both values are tiny compared to the starting loss values whose inclusion in the plot stretches out the $y$-axis. If you compress the $y$-axis to something more like $[0, 0.5]$, you are likely to see that the test loss is quite a bit higher. Doing this compression is legitimate, since the loss values from the early iterations correspond to the model guessing parameter values, so of course performance is terrible.

With that in mind, it is not so surprising that your second plot of the true vs predicted values shows worse performance on the test set.

$\endgroup$

Your Answer

By clicking “Post Your Answer”, you agree to our terms of service and acknowledge you have read our privacy policy.

Not the answer you're looking for? Browse other questions tagged or ask your own question.