3
$\begingroup$

Given a iid random samples $X\sim N(\theta,1)$, we have a unknown parameter $\theta$ and its estimator $T_n=T_n(X_1,\dots,X_n)$. If we have strictly proved that the convergence rate is $$ |T_n-\theta|=O_p(N^{-1/3}) $$ It seems that $T_n$ is a consistent estimator.

I would like to verify this convergence rate in the Monte Carlo simulation. I'm a little unclear on which quantity should I plot the Monte Carlo estimate? Is it Mean square error MSE? Say I have 1000 samples and each sample is repeated 500 times. It can be drawn that the MSE gradually converges to the x-axis as the number of samples increases.

I try to simulate the for a fix $\epsilon>0$, $$ P(|T_n-\theta|>\epsilon) $$

I fix $\epsilon =0.01$ and sample size $n=1000$. That is the mean of $|T_n^{j}-\theta|>\epsilon$ for replications $j=1,\dots, 30$. But I got the following result.

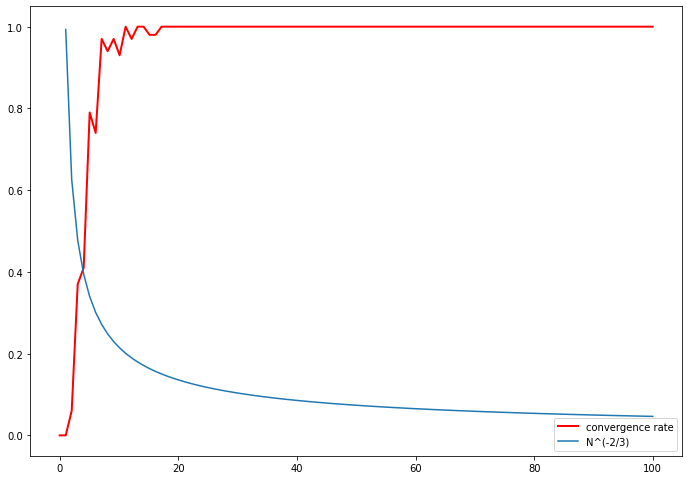
enter image description here

$\endgroup$

1 Answer 1

2
$\begingroup$

I'm not sure if it will work 100%, but to show that your estimator has the convergence rate of $O_p(N^{-\frac{1}{3}})$ and you want assess it, from the definition for any given $\epsilon > 0$: $$\lim_{n \rightarrow \infty} Pr(|T_n - \theta| > \epsilon) = 0 $$ So to evaluate this visualize I would suggest fixing some small $\epsilon$ and for each $n$ simulate $|T_n - \theta|$ several times, and calculate the empirical $Pr(|T_n - \theta| > \epsilon) $ and plot it. And with this you can see how the convergence will behave against $N^{-\frac{1}{3}}$. BTW it isn't prove anything, you need to make the theoretical calculations to demonstrate any statement.

$\endgroup$
5
  • $\begingroup$ Thank you! But what is the empirical of $P(|T_n-\theta|>\epsilon)$? For example, if we fix $\epsilon=0.01$ and $\theta=0$, that is $P(|T_n|>\epsilon)$. I am not sure what is the Monte Carlo estimate of this distribution. $\endgroup$
    – Hermi
    Commented Jul 20, 2022 at 1:56
  • $\begingroup$ What I have done is about the simulation of the expectation. For example, the empirical of expectation is the average of $\frac{1}{N}\sum T_n^j$ where I draw $T_n^j$ from each samples, $N$ is the number of replications. $\endgroup$
    – Hermi
    Commented Jul 20, 2022 at 1:57
  • $\begingroup$ To calculate the empirical $P(|T_n - \theta|) > \epsilon$ one way is fix $n$ and $\epsilon$ and simulate let's say for example 100 times $T_n$, and $i$ be the index of the simulation and then calculate $mean((|T_n^i - \theta|) > \epsilon)$ , $\endgroup$
    – Allan
    Commented Jul 20, 2022 at 13:17
  • $\begingroup$ Can you please see my edit? I simulate the mean of $|T_n^i-\theta|>\epsilon$. But the result is wired? $\endgroup$
    – Hermi
    Commented Jul 20, 2022 at 16:00
  • $\begingroup$ Yes, is the mean of this expression. I don't know what result being wired mean. $\endgroup$
    – Allan
    Commented Jul 20, 2022 at 16:05

Your Answer

By clicking “Post Your Answer”, you agree to our terms of service and acknowledge you have read our privacy policy.

Not the answer you're looking for? Browse other questions tagged or ask your own question.