0
$\begingroup$

I have a mixed-design, 1 between (group A and group B) and one within (pre and post). Anova, as well as mixed-effects model, showed non-significant results in the between, in the within, nor in their interaction. Descriptives and plots confirmed no differences between groups, but it seems that there are differences between pre and post (i.e., within level).

Edit 1: I've just realised that if I only test the main effects (between + within), and not their interaction (between*within) the within is significant. So the within factor is not significant because of the interaction tested (but the interaction is not significant).

Why is this happening? There are no differences at all between groups, and the starting point for the within variable (Time 1) is similar between groups. Still, "time" is not significant when including the interaction.

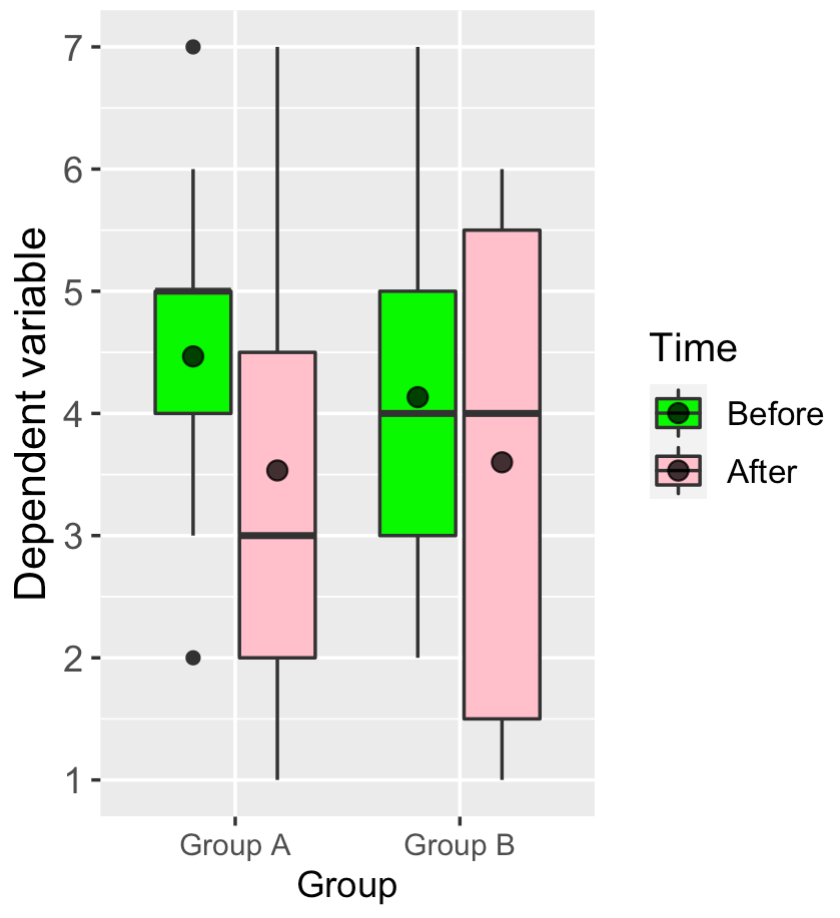
Edit 2: I am now wondering if this is a problem related to the small sample size, where the interaction did occur but there is not enough power to detect this effect (while in the boxplots the interaction is clear; in fact in one group 1 there are differences between times, while there are no differences in the other group). Are there any reference I could used to support my reasoning related to small sample and lack of power? Also, when I filtered the data, t-test and Wilcox confirmed that the the effect of time occurred only in one group.

Edit 3: I've got a bayes factor of 2.97999 for the effect of time + id, using anovaBF function, setting the model as follows:

anovaBF(dependent ~ time*exp_group + id, data = df, whichRandom = "id", progress=FALSE)

These are descriptive:

Group 1, Time 1 = mean (4.48), SD (1.26)
Group 2, Time 1 = mean (4.14), SD (1.42)

Group 1, Time 2 = mean (3.54), SD (1.78) 
Group 2, Time 2 = mean (3.61), SD (2.11) 

Here the boxplot of the interaction, the dots in the boxex are the means. enter image description here
$\endgroup$
2
  • $\begingroup$ It sounds like you are correct that what you are seeing is related to sample size. Specifically, that when you include the interaction term you are decreasing the residual degrees of freedom and losing power for the testing of other terms. It's difficult to know without seeing the data. $\endgroup$ Commented Jul 30, 2022 at 17:23
  • $\begingroup$ Thank you @SalMangiafico. I've just included the boxplot. I did run a power analysis and do not have the power - but this is only a pilot study. Still, I don't want to present biased results. What references I could use to sustain my argument? Thank you again. $\endgroup$
    – Santiago
    Commented Jul 30, 2022 at 17:51

1 Answer 1

1
$\begingroup$

As Sal Mangiafico said in a comment, this is probably due to small sample size combined with an attempt to estimate the additional coefficient for the interaction term. On the bright side, if this is a pilot study as you indicate in a comment, then there isn't an "argument" about statistical "significance" that you need to make. The question for your and your colleagues is what to do next.

Your pilot data have identified a potential difference between the 2 Groups in post-pre differences. You can show your data analyzed in several different ways (e.g., the full interaction model, the model without the interaction, the separate models for the 2 Groups), as you are still in an exploratory phase of the project. You also can show what you found about the clock-time differences in post-pre values as something that needs (ideally) to be controlled directly or at least accounted for statistically.

There's no bias (in the colloquial or the technical sense) in presenting results that way so long as you are transparent about what you are doing and make it clear that these are pilot data. Your presentations should be focused on getting advice about what to do next. "Statistical significance" isn't an issue with pilot data.

A major piece of advice to get: how big a difference would be considered interesting to those in your field of study? Next, using your data as a guide for (prospective) power analysis, you can determine how big a study you would need to identify a difference of that size reliably. Then you can decide whether the costs of doing that big a study are worth it.

One warning: your boxplots suggest that your outcomes are from something like a single 7-point Likert item. If so, such data aren't well handled by ANOVA, which assumes continuous outcome data. Use your data to explore and choose other methods better suited to such data for your full-scale study.

$\endgroup$
0

Your Answer

By clicking “Post Your Answer”, you agree to our terms of service and acknowledge you have read our privacy policy.

Not the answer you're looking for? Browse other questions tagged or ask your own question.