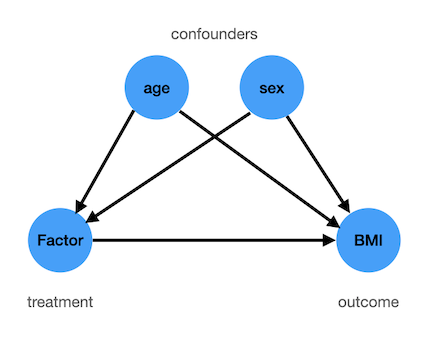
I will presume, that in your example, Factor is the treatment, BodyMassIndex is the outcome, and you are interested in the causal effect of the treatment Factor on the outcome BodyMassIndex. Since you are referring to treatment and control groups, I presume that the treatment Factor is binary. So the treatment group is those people that have been treated with Factor and the control group is those that haven't.
If you want to learn the causal effect from data that has not been created with proper randomization of the treatment, you have to look out for confounders, because they have to be treated specially in your analysis, otherwise, they can screw up your results. Confounders are variables that causally affect both treatment and outcome. In your example, age and sex are such confounders. I.e., you have the following causal relations:

And this "special treatment" of confounders is referred to as "adjusting" or "controlling" for those confounders (age and sex).
Here is what could go wrong with confounders: Let's say that the treatment variable is "being online several hours the day", and that while most older people don't do it, pretty much all younger people do. Furthermore, presume that younger people have a better BMI. So you have that age is causally influencing both treatment and outcome. And the result of your survey would be that being online several hours a day improves your BMI.
To avoid those wrong conclusions, you need to "adjust" for confounders like age. Intuitively, one way to adjust is to select a subset of your data for which, in both treatment and control groups, the age distribution is the same.
But there are several possible ways to adjust for confounders. If you know that the relations between the variables are approximately linear you can use linear regression in the way you mentioned, including all the confounders in the model, and then the coefficient of the treatment variable (Factor) gives you the causal effect. Note, that this approach does not require an equal number of participants in the two groups. You don't have to change your data. Regression, "automatically", does the right thing if you include all the confounders.
Another approach to adjusting for confounders is matching. This is similar to the intuitive solution described in the example above. There are several advantages and disadvantages of matching compared to the above regression approach, and many books and papers have been written to compare those.
It is also often beneficial, to use both methods together. For this hybrid approach, software is available, too.
Finally, the term "balancing" is only used in relation to matching and is some kind of quality indicator of your matching results. You have a good balance if the distribution of all the covariates in both the treatment and control groups are similar. E.g., in the example above, the ratio of young and old persons should be the same in treatment and in control. Note, that this doesn't mean that the total count of individuals must be the same in treatment and control. We only need the proportion to be similar.

