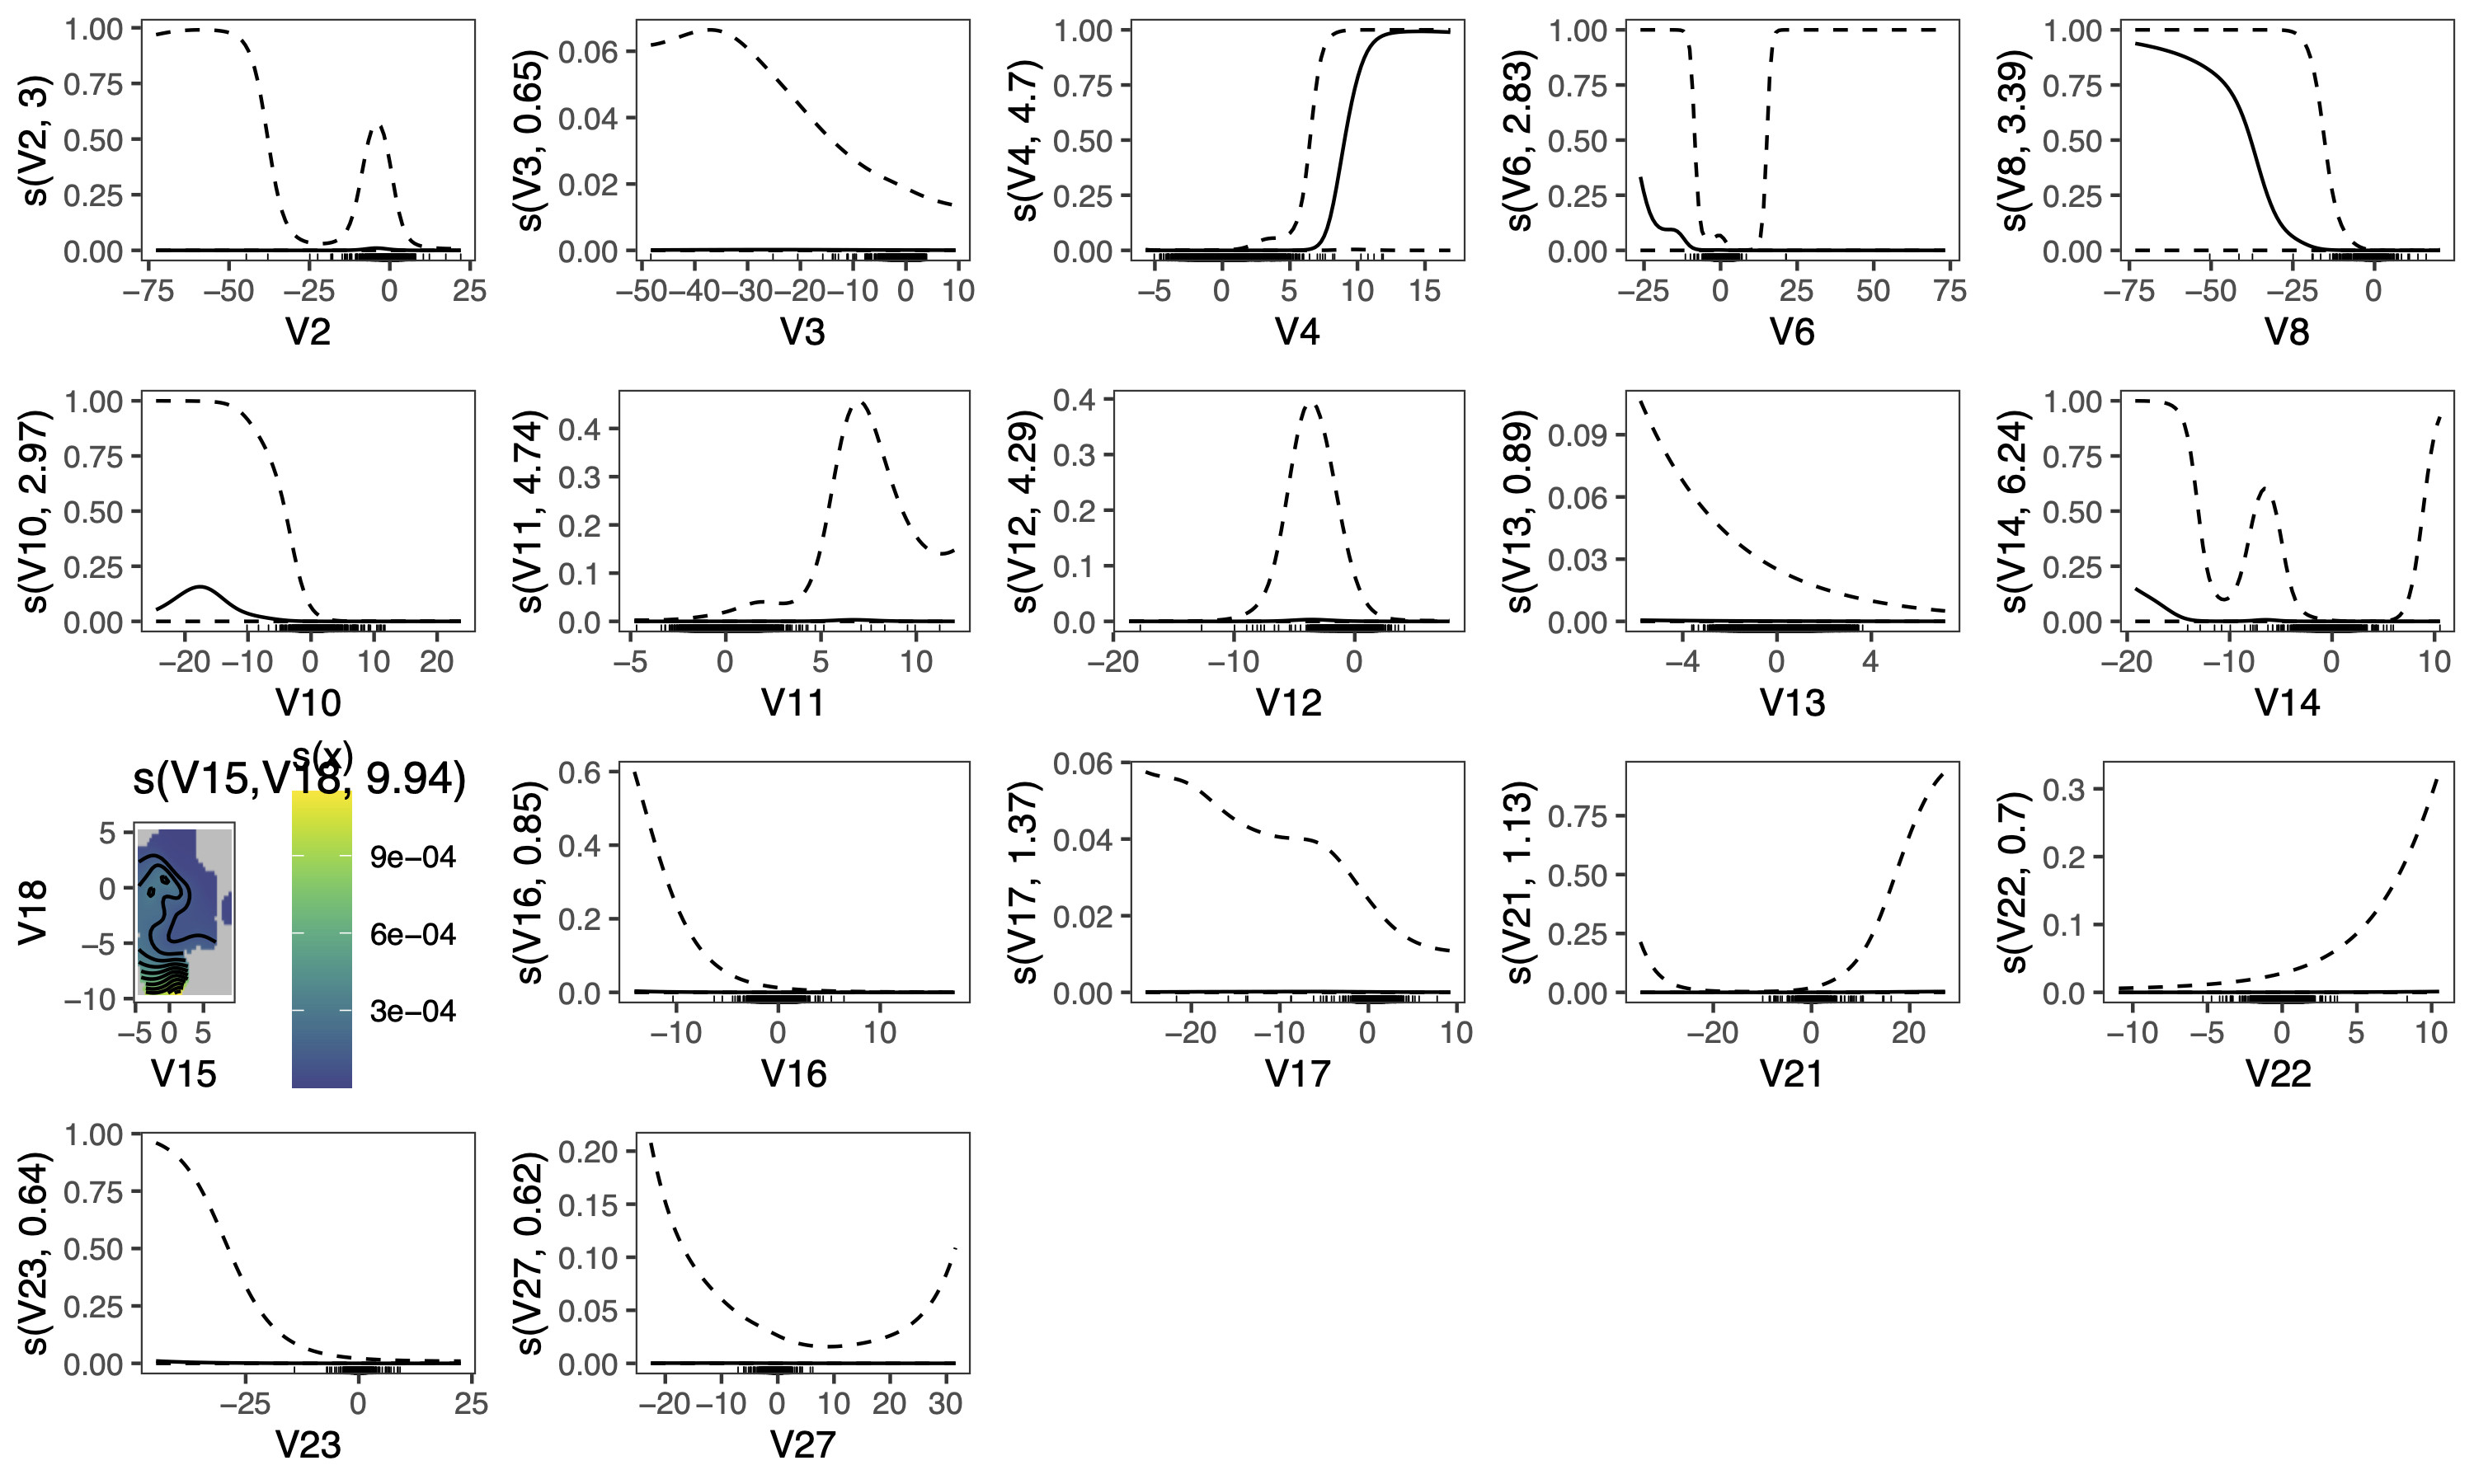
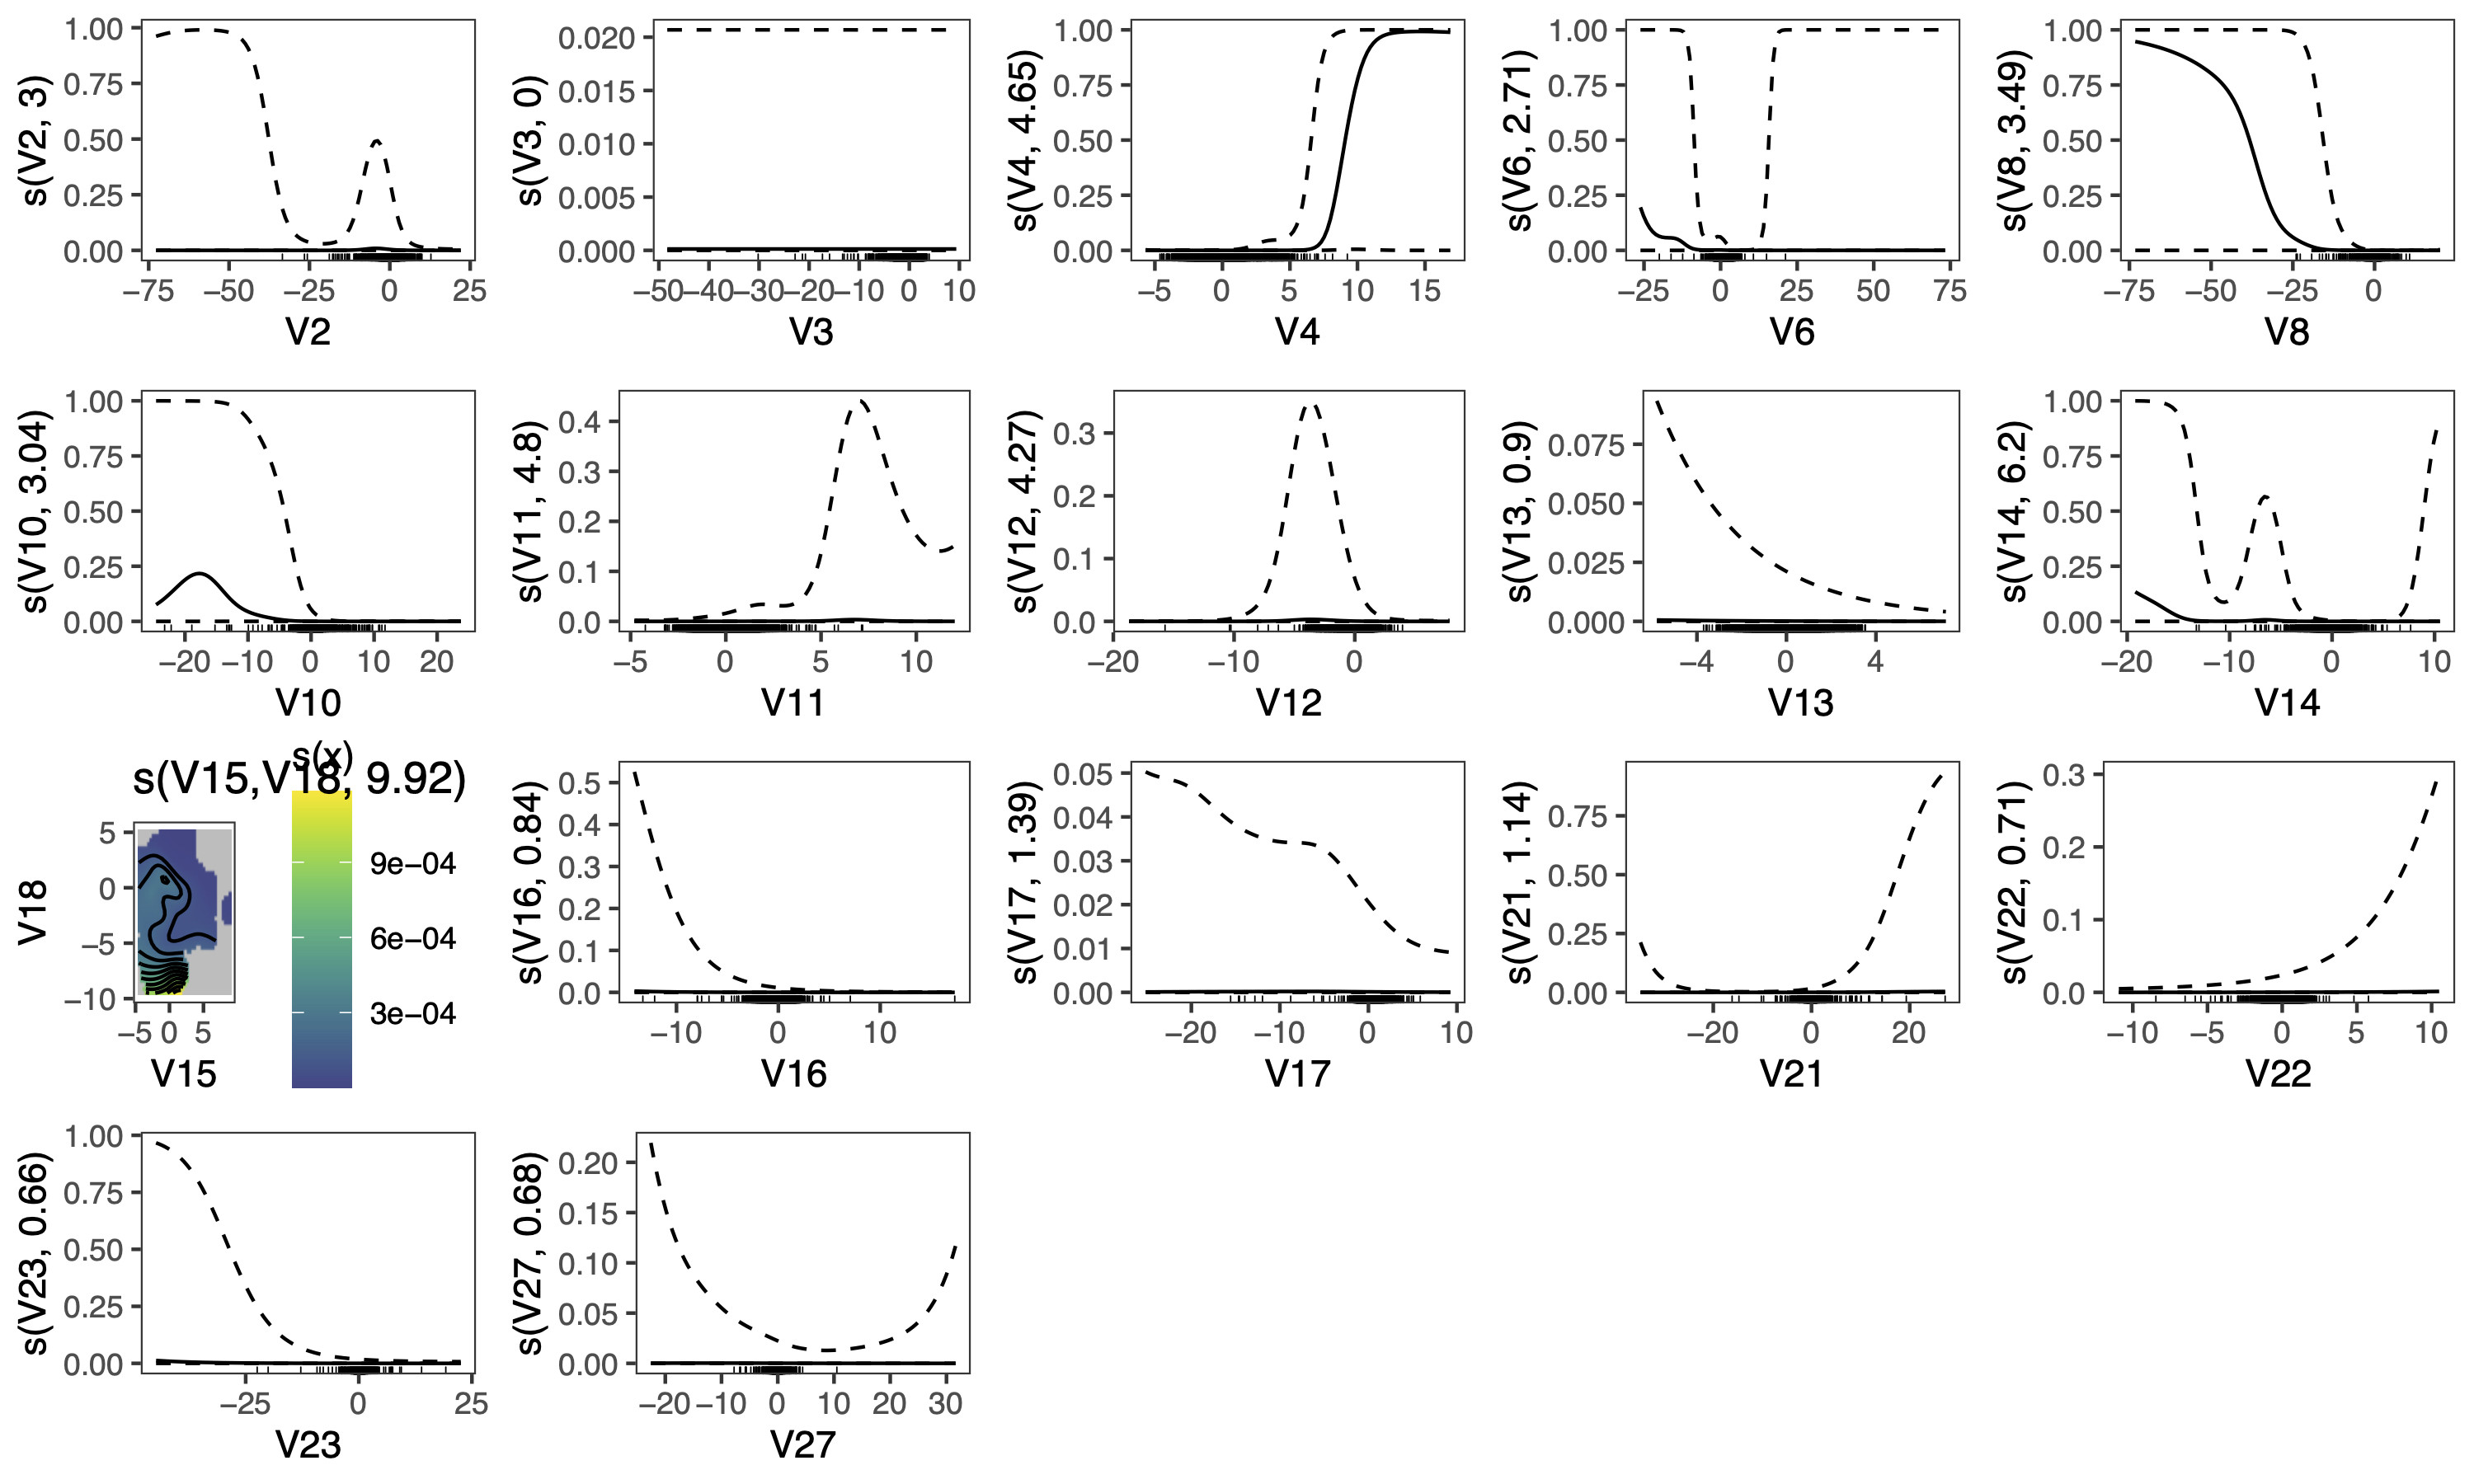
I'm using the mgcv (1.8-40) bam() function with discrete==TRUE method to fit in GAM for a very large dataset. It occurs that the summary table and results of the same fitted model differ by computer RAMs (cluster vs PC). I'm using the Fraud Detection - Credit Card data from Kaggle to generate reproducible examples below:
library(mgcv)
library(mgcViz)
credit<-data.table::fread("creditcard.csv")
bam3<-bam(class~s(V2)+s(V3)+s(V4)+s(V6)+s(V8)+s(V10)+
            s(V11)+s(V12)+s(V13)+s(V14)+s(V15,V18)+s(V16)+s(V17)+
            s(V21)+s(V22)+s(V23)+s(V27), family=binomial(link = "logit"),
          data=credit, discrete=TRUE, select=TRUE)
summary(bam3)
#use mgcviz to visualize results
t <- getViz(bam3)
print(plot(t, allTerms = T, trans = function(x){
  plogis(coef(bam3)[1] + x)}, seWithMean = TRUE, ylab="Fraud probability"), pages = 1)
Here are the summary table and result plots when running the model on my PC and a cluster with smaller RAM:
Family: binomial
Link function: logit

Formula:
class ~ s(V2) + s(V3) + s(V4) + s(V6) + s(V8) + s(V10) + s(V11) +
    s(V12) + s(V13) + s(V14) + s(V15, V18) + s(V16) + s(V17) +
    s(V21) + s(V22) + s(V23) + s(V27)

Parametric coefficients:
            Estimate Std. Error z value Pr(>|z|)
(Intercept)   -8.946      2.686   -3.33 0.000867 ***
---
Signif. codes:  0 ‘***’ 0.001 ‘**’ 0.01 ‘*’ 0.05 ‘.’ 0.1 ‘ ’ 1

Approximate significance of smooth terms:
              edf Ref.df  Chi.sq  p-value
s(V2)      2.9980      9  21.478 4.92e-06 ***
s(V3)      0.6508      9   1.137  0.13907
s(V4)      4.6965      9 163.282  < 2e-16 ***
s(V6)      2.8267      9  10.310  0.00635 **
s(V8)      3.3933      9  69.022  < 2e-16 ***
s(V10)     2.9709      9  59.061  < 2e-16 ***
s(V11)     4.7405      9  30.051 2.37e-06 ***
s(V12)     4.2906      9  77.346  < 2e-16 ***
s(V13)     0.8916      9   8.225  0.00193 **
s(V14)     6.2394      9 171.185  < 2e-16 ***
s(V15,V18) 9.9426     29  32.406 1.26e-05 ***
s(V16)     0.8480      9   5.578  0.00729 **
s(V17)     1.3670      9   4.075  0.02791 *
s(V21)     1.1263      9   7.574  0.00196 **
s(V22)     0.7039      9   2.377  0.05558 .
s(V23)     0.6409      9   1.785  0.08236 .
s(V27)     0.6212      9   1.024  0.16234
---
Signif. codes:  0 ‘***’ 0.001 ‘**’ 0.01 ‘*’ 0.05 ‘.’ 0.1 ‘ ’ 1

R-sq.(adj) =   0.77   Deviance explained = 81.2%
fREML = 2.625e+05  Scale est. = 1         n = 284807
Compared to the summary table and result plots when running the model on a cluster with larger RAM (>80G):
Family: binomial
Link function: logit

Formula:
class ~ s(V2) + s(V3) + s(V4) + s(V6) + s(V8) + s(V10) + s(V11) +
    s(V12) + s(V13) + s(V14) + s(V15, V18) + s(V16) + s(V17) +
    s(V21) + s(V22) + s(V23) + s(V27)

Parametric coefficients:
            Estimate Std. Error z value Pr(>|z|)
(Intercept)   -8.946      2.596  -3.446 0.000569 ***
---
Signif. codes:  0 ‘***’ 0.001 ‘**’ 0.01 ‘*’ 0.05 ‘.’ 0.1 ‘ ’ 1

Approximate significance of smooth terms:
                 edf Ref.df  Chi.sq  p-value
s(V2)      3.000e+00      9  21.705 4.87e-06 ***
s(V3)      3.774e-05      9   0.000  0.16275
s(V4)      4.655e+00      9 163.440  < 2e-16 ***
s(V6)      2.708e+00      9  10.098  0.00639 **
s(V8)      3.493e+00      9  69.669  < 2e-16 ***
s(V10)     3.035e+00      9  63.367  < 2e-16 ***
s(V11)     4.799e+00      9  31.079 1.72e-06 ***
s(V12)     4.271e+00      9  76.626  < 2e-16 ***
s(V13)     8.950e-01      9   8.525  0.00164 **
s(V14)     6.203e+00      9 174.908  < 2e-16 ***
s(V15,V18) 9.921e+00     29  32.000 1.53e-05 ***
s(V16)     8.395e-01      9   5.230  0.00907 **
s(V17)     1.390e+00      9   4.173  0.02693 *
s(V21)     1.139e+00      9   7.847  0.00167 **
s(V22)     7.100e-01      9   2.448  0.05325 .
s(V23)     6.571e-01      9   1.916  0.07646 .
s(V27)     6.770e-01      9   1.159  0.15171
---
Signif. codes:  0 ‘***’ 0.001 ‘**’ 0.01 ‘*’ 0.05 ‘.’ 0.1 ‘ ’ 1

R-sq.(adj) =   0.77   Deviance explained = 81.2%
fREML = 2.625e+05  Scale est. = 1         n = 284807
Note the difference in coefficients of each covariates, especially V3, V6, V12, V13, V15*V18, V16, V17.
This is not the best model to fit the data, but I chose it to replicate the issue that I've been experiencing with my own data. I'm puzzled by the different results on different machines, and would like to know which are the more reliable ones.


