1
$\begingroup$

I just want to preface this with the fact it is not a home work question. I am also not a stats person so I am not sure even how to start with calculating this, what it is called or where to look. When I google I get not much that looks like it helps.

So my problem, assume you have a 30 team league. Any game between two teams has a 50% chance of winning or losing, essentially a coin flip. I know that at the end of the runs all the teams wont have equal amount of wins, you'll get a normal distribution or bell curve.

How do I calculate what the standard deviations of the win% for each team would be? Let's assume 500 games.

How would I solve this? How would I even start?

Thanks

$\endgroup$

1 Answer 1

3
$\begingroup$

Consider the number of wins for team $i$ alone (we can convert that to a percentage at the end, by dividing by the number of games and multiplying by 100).

From your statements the results for the other teams have the same distribution by symmetry (though the realizations will be different because of random variation).

For team $i$, we have:

  • The team plays $n$ games.

  • each game it has a 50% chance of winning

  • the outcome of each game is independent of the outcome of every other game

The outcome of a single game is a $\text{Bernoulli}(p)$ random variable, where $p = 0.5$ - i.e. a metaphorical 'coin toss'.

The distribution of the number of wins for team $i$ is therefore $\text{binomial}(n, 0.5)$.

The standard deviation of a $\text{binomial}(n, p)$ is $\sqrt{n p (1-p)}$ so the standard deviation of the number of wins for team $i$ is $\sqrt{n/4}$.

The proportion of wins is just a scaled binomial, where the count is multiplied by $1/n$.

That means the standard deviation of the proportion of wins is $\frac{\sqrt{n/4}}{n}=\frac{1}{\sqrt{4n}}$.

The percentage of wins is just a scaled binomial, where the count is multiplied by $100/n$.

That means the standard deviation of the percentage of wins for team $i$ is $\frac{100}{\sqrt{4n}}=\frac{5}{\sqrt{n}}\%$.

Your $n=500$, so:

  • the number of wins has mean 250 and standard deviation 11.2

  • the proportion of wins has mean 0.5 and standard deviation 0.0224

  • the percentage of wins has mean 50% and standard deviation 2.24%
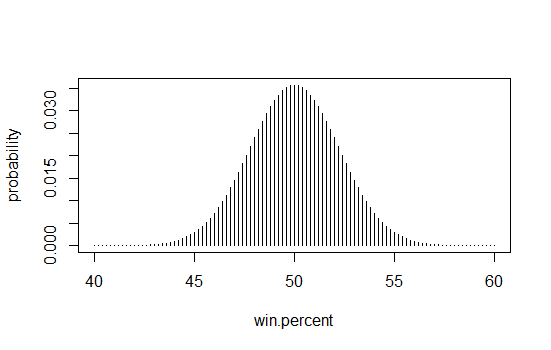
percentage of wins for team i

Note that the results of teams $i$ and $j$ are not independent, however, so if you start looking as sums of wins or differences of wins over more than one team, you have to take that into account. Similarly, if you combine the distributions across teams, even though the individual marginal distributions are all the same, there will be slightly more 'structure' to the combined results than you'd see from a random sampling of the individual distribution. (The mean and standard deviation of the number of wins will be fixed, for example.)


Results for an 82-game season:

A regular season has $n=82$, so:

  • the number of wins has mean 41 and standard deviation 4.53

  • the proportion of wins has mean 0.5 and standard deviation 0.0552

  • the percentage of wins has mean 50% and standard deviation 5.52%
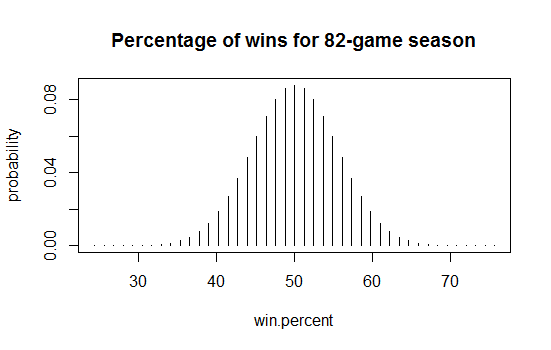
percent of wins in 82-game season

$\endgroup$
12
  • 2
    $\begingroup$ That link doesn't say how many games he simulated. How do you know what the $n$ is? Also note that the 38% he mentions is not the standard deviation. $\endgroup$
    – Glen_b
    Commented May 16, 2013 at 2:20
  • 1
    $\begingroup$ Reading around, it looks to me like the 2011-12 regular season was only 82 games for each team. Would he have used an $n$ of about that size? It produces results almost identical to his green curve (except it shouldn't be drawn as a curve). $\endgroup$
    – Glen_b
    Commented May 16, 2013 at 2:39
  • 1
    $\begingroup$ with the exception of this season (strike shortened), 82 games is the normal length of a hockey season. $\endgroup$ Commented May 16, 2013 at 2:48
  • 1
    $\begingroup$ @ClarkW.Griswold Thanks for the confirmation. Then it seems weird for the OP to be asking us to use n=500; he would almost certainly have simulated a regular season. I have now included the results for an 82-game season. I can only hope the OP will check back. $\endgroup$
    – Glen_b
    Commented May 16, 2013 at 2:59
  • 1
    $\begingroup$ The results are consistent with approximately 1 season. On the 38% - if that's actually what the 38% represents then the description in the linked article is wrong. In fact I think that description in the linked article is probably wrong in any case. $\endgroup$
    – Glen_b
    Commented May 16, 2013 at 9:44

Your Answer

By clicking “Post Your Answer”, you agree to our terms of service and acknowledge you have read our privacy policy.

Not the answer you're looking for? Browse other questions tagged or ask your own question.