1
$\begingroup$

Suppose we have a linear model $Y=X \beta + \epsilon$ where $\epsilon \sim N(0, \sigma^2 I)$ and let $H$ be the projection matrix into the column space of $X$. We define the residual $e$ as the projection of $Y$ into span$(X)$ (i.e. $e=(I-H)\epsilon \text{ }$).

A statement says that : by construction, $X^T e=0$ and it implies that no correlation should appear between explanatory variables and residuals.

I can convince myself that the statement is true by saying that if $X_i$ is a column of $X$, then using the fact that $E(e)=0$, we have $Cov(X_i,e)=\Bbb E(X_i. e)- \Bbb E(X_i )\Bbb E(e)=0 \implies Corr(X_i,e)=0$.

However, I don't really intuitively see why there should or not be any correlation between explanatory variables and residuals. Can someone explain the intuition behind the statement ?

$\endgroup$
2
  • 2
    $\begingroup$ The residuals are what you haven't explained with your explanatory variables. That's how they are defined. If there were a better explanation using those variables, meaning with a coefficient that would work better, then the machinery you used didn't find it. In reverse, what would count as intuitive here? Do you seek a different explanation in terms of algebra or geometry, for example? Often when people say that something is intuitive, they just mean familiar. "The user interface is intuitive" $=$ you'll get used to it, or it's like that in other programs you should have used. $\endgroup$
    – Nick Cox
    Commented Oct 30, 2022 at 12:57
  • $\begingroup$ @NickCox Your explanation is a nice. I am open for any aspects of explanations : algebra, geometry, etc. What I meant by intuition is for example that a 0-torsion curve is in a plane (maybe not the best example illustrating what I want to say) but I am looking for an explanation that does not need to be very formal, but that explains why we should expect things to behave like this. What happens if we observe a correlation ? What happens if the correlation is 0 but there is still a non-linear fashion when plotting things ? $\endgroup$
    – Kilkik
    Commented Oct 30, 2022 at 15:50

1 Answer 1

4
$\begingroup$

Nick Cox answered OP's query in the comment:

The residuals are what you haven't explained with your explanatory variables. That's how they are defined.

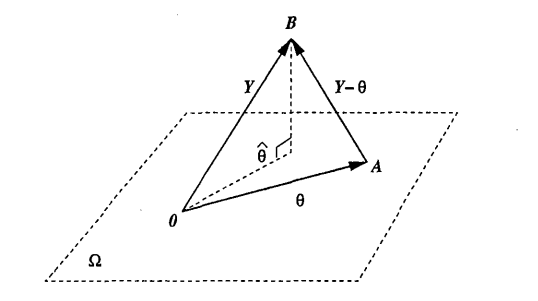
Take a quick glance at what the least square does geometrically:

enter image description here

In the figure, $\Omega := \mathcal C(\mathbf X). $ One needs to seek $\boldsymbol\theta \in \mathcal C(\mathbf X) $ such that $\rm AB$ is minimum. From the figure, it can be noticed $\hat{\boldsymbol\theta}$ does the job. Method of least squares yields the desired $\hat{\boldsymbol\theta}$ which is the projection of $\mathbf Y$ on $\Omega.$ Again noticing the figure dictates us the following:

$$\left(\mathbf Y-\hat{\boldsymbol\theta}\right) \perp \Omega.\tag 1\label 1$$

What is $\mathbf Y-\hat{\boldsymbol\theta}? $ It is the residual vector $\mathbf e. $ So, what $\eqref 1$ is implying is that $\mathbf e$ is orthogonal to $\mathcal C(\mathbf X) $ that is, $\mathbf e$ cannot be expressed as the linear combination of the columns of $\mathbf X. $


Source of the figure:

$\rm [I]$ Linear Regression Analysis, George A. F. Seber, Alan J. Lee, John Wiley & Sons, $2003, $ Fig. $3.1, $ p. $37.$

$\endgroup$

Your Answer

By clicking “Post Your Answer”, you agree to our terms of service and acknowledge you have read our privacy policy.

Not the answer you're looking for? Browse other questions tagged or ask your own question.