3
$\begingroup$

I have 60 continuous features (i.e., lab results) for 35,000 patients, and the patients are divided into three groups. I want to evaluate each feature to find out what the differences are between the groups.

Here is my plan:

  1. For each feature, iteratively run a one-way ANOVA independently.
  2. After 60 ANOVA are run, correct for multiple comparisons using Bonferroni correction.
  3. Using only the significant features (as per the ANOVA with Bonferroni), run a post-hoc analysis (Tukey's HSD) for each one.
  4. Use the p-value results from Tukey's HSD to confirm any significant pairwise differences between the groups. Assume there is no need for additional Bonferroni correction at this stage.

Is this an acceptable approach? Or do I need to use a multi-way ANOVA for this? Or MANOVA?

$\endgroup$

3 Answers 3

1
$\begingroup$

I would suggest a different approach, that yields two features that separate the three groups best. The approach is called "Linear Discriminant Analysis" (LDA) and is a means to extract new features as linear combinations from the original features.

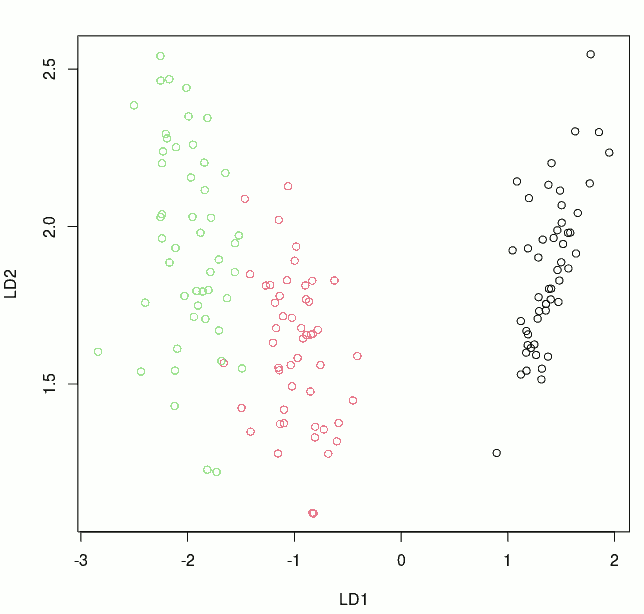
The number of features it extracts are the number of groups minus one, which is two in your case. This has the nice side effect that you can easily visualize the discrimination of the three groups by means of these new features in a two dimensional plot.

Here is an example R code with the iris dataset (3 classe, 4 original features):

> library(MASS)
> res <- lda(iris[,-5], iris$Species)
> scale.norm <- scale(res$scaling, center=FALSE, scale=sqrt(colSums(res$scaling^2)))
> scale.norm
                    LD1          LD2
Sepal.Length  0.2087418  0.006531964
Sepal.Width   0.3862037  0.586610553
Petal.Length -0.5540117 -0.252561540
Petal.Width  -0.7073504  0.769453092
> x.lda <- as.matrix(iris[,-5]) %*% as.matrix(scale.norm)
> plot(x.lda, col=iris$Species)

Plot of LDA-extracted Features

$\endgroup$
0
$\begingroup$

Discriminant analysis as suggested in a previous answer is a possibility: you should realize, however, that only indirectly (through the coefficients of the linear discriminant functions) will tell you which features appear to be different among groups.

A Bonferroni correction in the case of 60 simultaneous tests will declare a feature as significant only if the individual ANOVA for that feature rejects the null hypothesis at the $\alpha/60$ significance level, were $\alpha$ is the desired nominal level. You would pick as significant only results for which the evidence is really overwhelming.

MANOVA (much like discriminant analysis) has the advantage over multiple univariate ANOVAs that it accounts for possible correlation among features. On the other hand (much like linear discriminant analysis) it assumes equal covariance matrices across groups, which is a quite strong assumption.

$\endgroup$
2
  • $\begingroup$ It should be noted that the LDA coefficients not only depend on the discriminatory power of the features, but also on their range. To use them as a measure of feature importance would require to scale them all to the same range. $\endgroup$
    – cdalitz
    Commented Nov 18, 2022 at 13:16
  • $\begingroup$ @cdalitz, what you say is quite correct. Quite frequently data are normalized (or equivalently, the correlation matrix rather than the covariance matrix is input to the LDA procedure), which would take care of your objection. $\endgroup$
    – F. Tusell
    Commented Nov 19, 2022 at 9:00
0
$\begingroup$

Try (multinomial) logistic regression. That way you will avoid multiplicity problems, and also the overly strict assumptions behind discriminant analysis.

This is very close to the post T-tests, manova or logistic regression - how to compare two groups?, which is similar but for two groups.

$\endgroup$

Your Answer

By clicking “Post Your Answer”, you agree to our terms of service and acknowledge you have read our privacy policy.

Not the answer you're looking for? Browse other questions tagged or ask your own question.