As to the first question, I agree with Dave that the F test does not perform multiple comparisons, but just one. You would possibly run into a multiple comparison issue if you did separate t tests on each education level to find out which has a nonzero effect.
With the F test, you "only" have the alternative hypothesis that there is at least one level that has a nonzero effect, but if you reject, the "price" you pay for using the F test is that you do not know which level is "responsible" for the rejection.
As to the second question, somewhat to my surprise (but see the comments below), this little simulation does not find any sensitivity of the F test to what is near perfect multicollinearity when we test for the relevance of all correlated predictors (see below for an edit).
library(lmtest)
library(mvtnorm)

n <- 30
reps <- 5000
k <- 2
critical.value <- qf(p = .95, df1 = k, df2 = n-k)

covariance <- 0.999
Fstat <- rep(NA,reps)

for (i in 1:reps){
  y <- rnorm(n)
  X <- rmvnorm(n, sigma = matrix(c(1,covariance,covariance,1), ncol=2))
  reg <- lm(y~X)
  Fstat[i] <- waldtest(reg, test="F")$F[2]
}

mean(Fstat>critical.value)

hist(Fstat, breaks = 100, col="lightblue", freq = F, xlim=c(0,5))
x <- seq(0, 6, by=.01)
lines(x, df(x, df1 = k, df2 = n-k), lwd=2, col="purple")
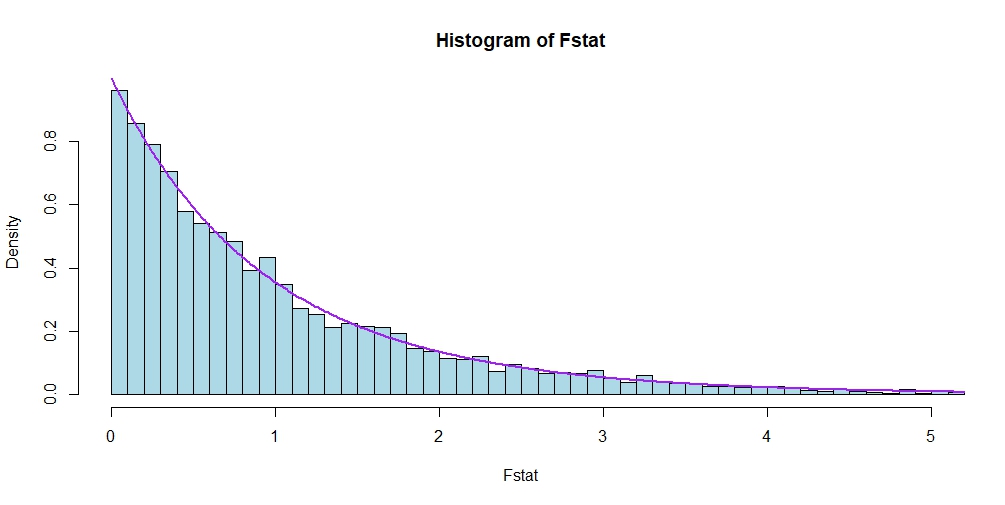
The rejection rate (mean(Fstat>critical.value)) is, even for relatively small $n=30$ and very strong covariance of the regressors (0.999), still very close to the nominal 0.05, and the histogram and theoretical null density agree very well:

EDIT: Here is a modification of the code that, in response to Dave's comment , tests only one of the two correlated predictors (so that the F statistic is then nothing but a squared t-statistic), and the result still appears to go throgh:
library(lmtest)
library(mvtnorm)

n <- 30
reps <- 5000
k <- 2
critical.value <- qf(p = .95, df1 = k-1, df2 = n-k)


covariance <- 0.999
Fstat <- rep(NA,reps)

for (i in 1:reps){
  y <- rnorm(n)
  X <- rmvnorm(n, sigma = matrix(c(1,covariance,covariance,1), ncol=2))
  X1 <- X[,1]
  X2 <- X[,2]
  reg <- lm(y~X1+X2)

  regX1 <- lm(y~X1)
  Fstat[i] <- waldtest(reg, regX1, test="F")$F[2]
}

mean(Fstat>critical.value)

hist(Fstat, breaks = 200, col="lightblue", freq = F, xlim=c(0,5))
x <- seq(0, 6, by=.01)
lines(x, df(x, df1 = k-1, df2 = n-k), lwd=2, col="purple")

