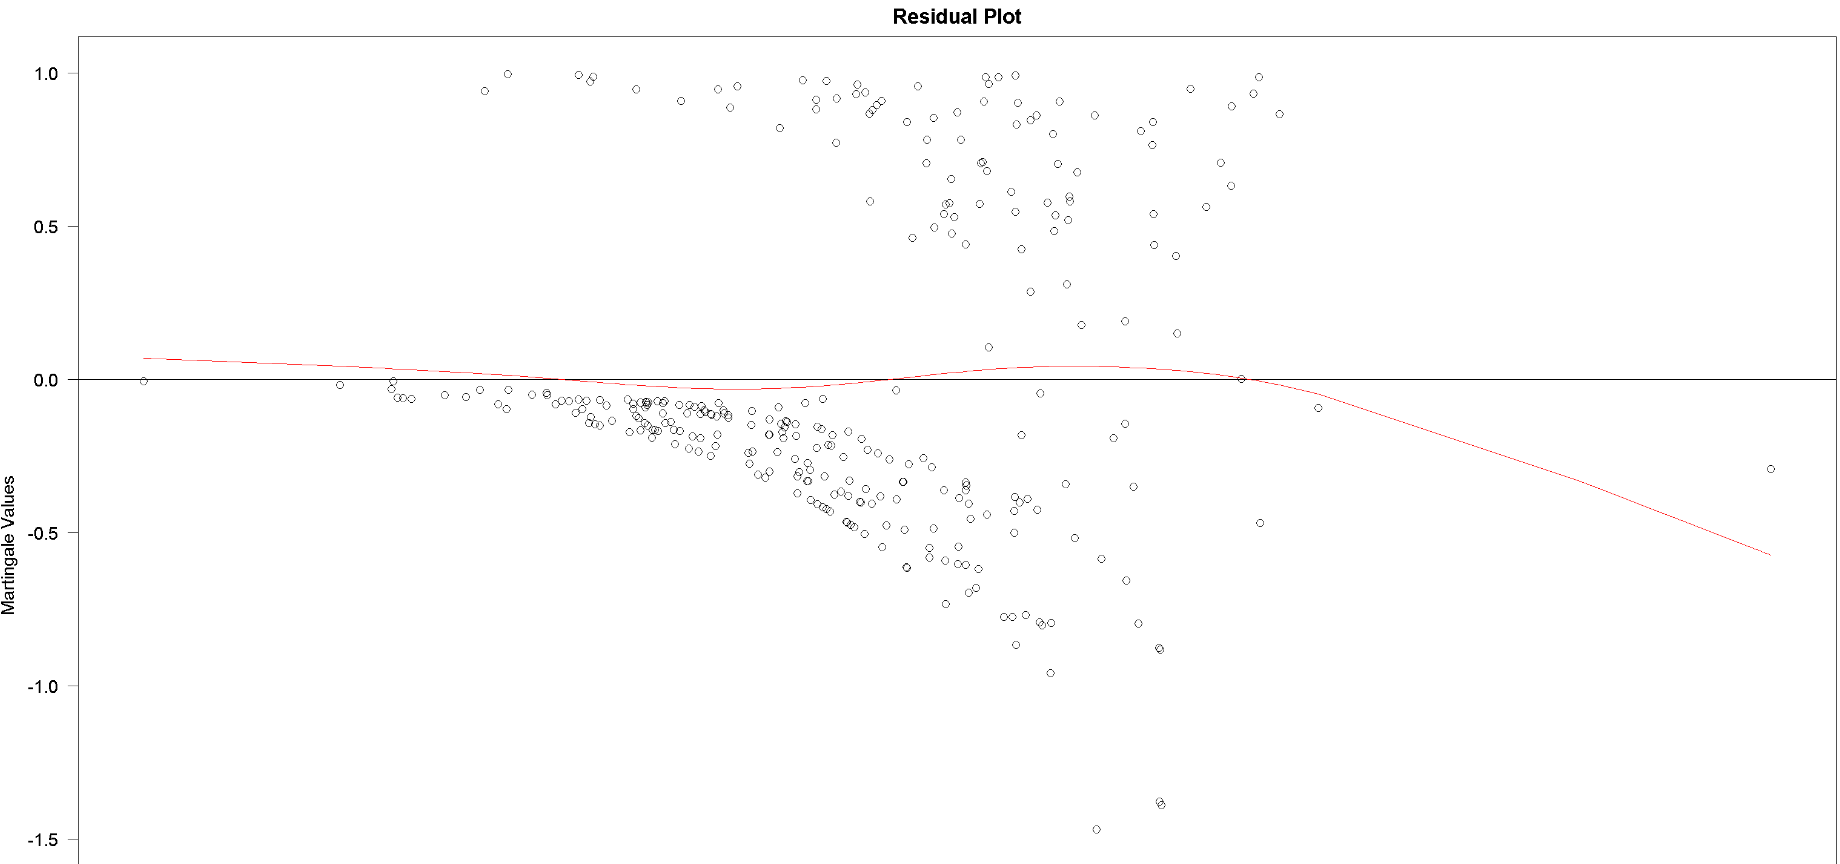
It's not clear how the plot of martingale residuals (top) was obtained, and the label of the x-axis is missing. If these are overall residuals, then heed the warning of Therneau and Grambsch (Section 4.2.2)
... martingale residuals can not play all the roles that linear model residuals do; in particular, the overall distribution of the residuals does not aid in the global assessment of fit.
There are ways to use martingale residuals to evaluate the functional form of a continuous predictor, but that doesn't seem to be what you've done. See this page.
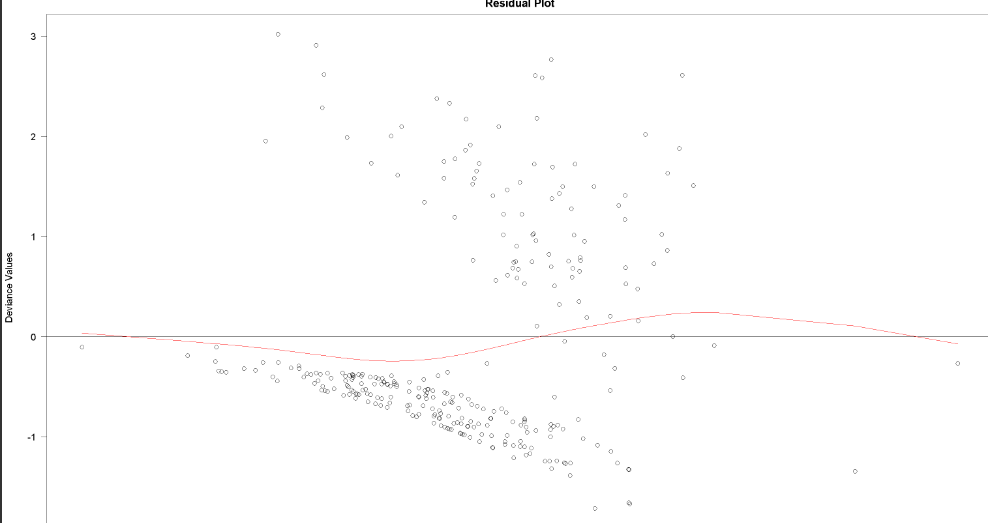
The deviance residuals in the bottom plot are transformations of the martingale residuals. From Section 4.3 of Therneau and Grambsch:
The deviance residual was designed to improve on the martingale residual for revealing individual outliers, particularly in plotting applications. In practice it has not been as useful as anticipated.
So neither of your plots seems to get directly to evaluating the linearity of the model.
The way to "go about identifying the non-linear variables" is one at a time. For each continuous predictor you plot the martingale residuals against the corresponding values of that predictor. Then a "flat" smoothed curve indicates a reasonable fit of that predictor. This only makes sense for continuous predictors. Categorical predictors are necessarily "linear," although they might violate the proportional hazards assumption.


