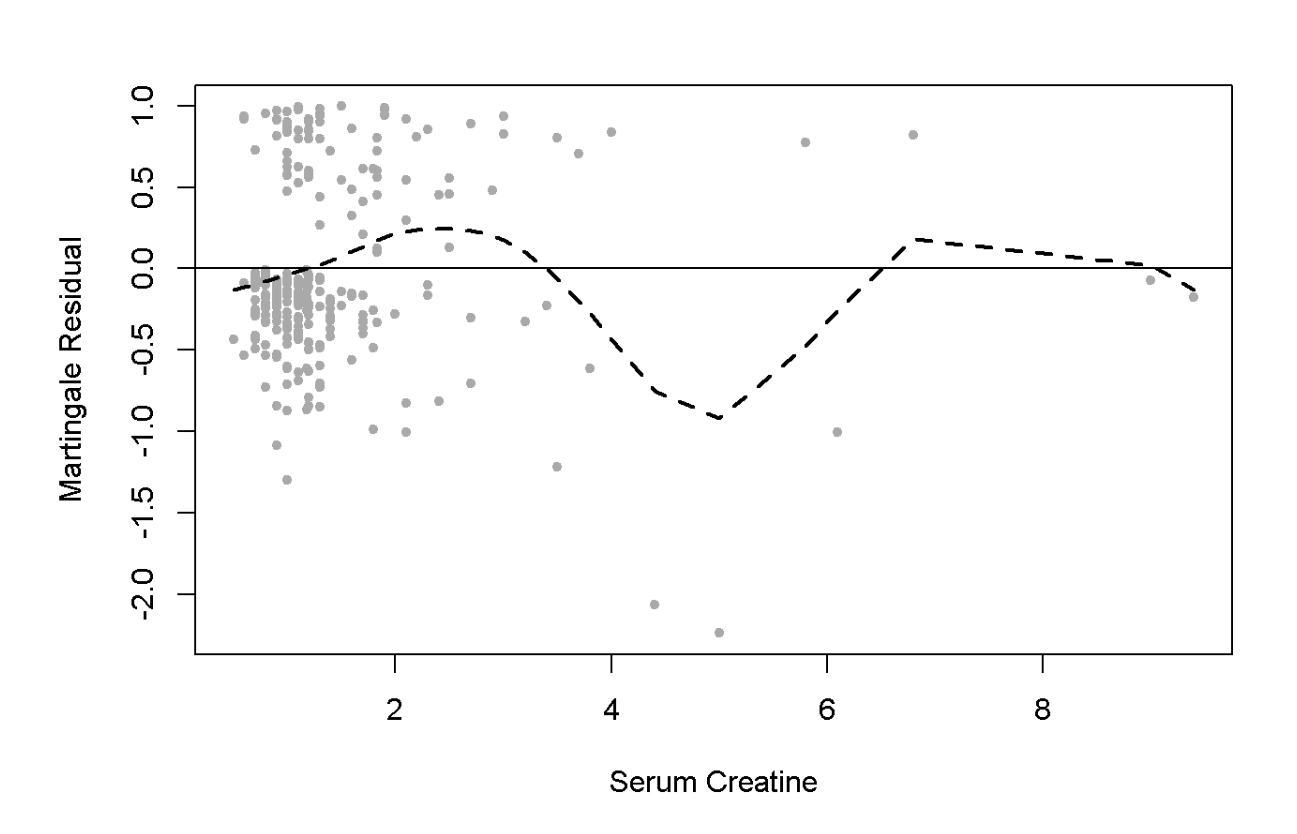
There is often not a "yes/no" answer to this type of question. Linearity is almost never perfect in real-world data. You have to apply your understanding of the subject matter to decide if any lack of linearity between the outcome and the predictor is big enough to matter.
In this particular situation, you might consider whether the two data points with very negative martingale residuals (and thus deviance residuals) represent outliers due to errors in data collection, with the usual precautions about (a) removing cases just because they seem to be outliers and (b) only evaluating cases with large residuals for potential errors in data collection.
In general, it's best for this type of evaluation to use a smoothed fit together with an estimate of the error in the smooth. That doesn't seem to be very straightforward with the smooth.spline() you used. I suspect that there's a lot of error in the estimate of the smooth in the region that concerns you. A loess() fit can return both the curve and error estimates, with its associated predict() function. That might be even more simply done with the ggplot2 package and its built-in functions like geom_smooth().
You also allowed for an extremely flexible fit with 7 degrees of freedom. That's perhaps appropriate if you have reason to expect rapid local changes in the Y-X association, but for this type of model any underlying non-linearity is more likely to be gradual. Finally, with most of your values at the lower end of the range, a display with serum_creatinine on a log scale might be more representative of the data set as a whole.

