3
$\begingroup$

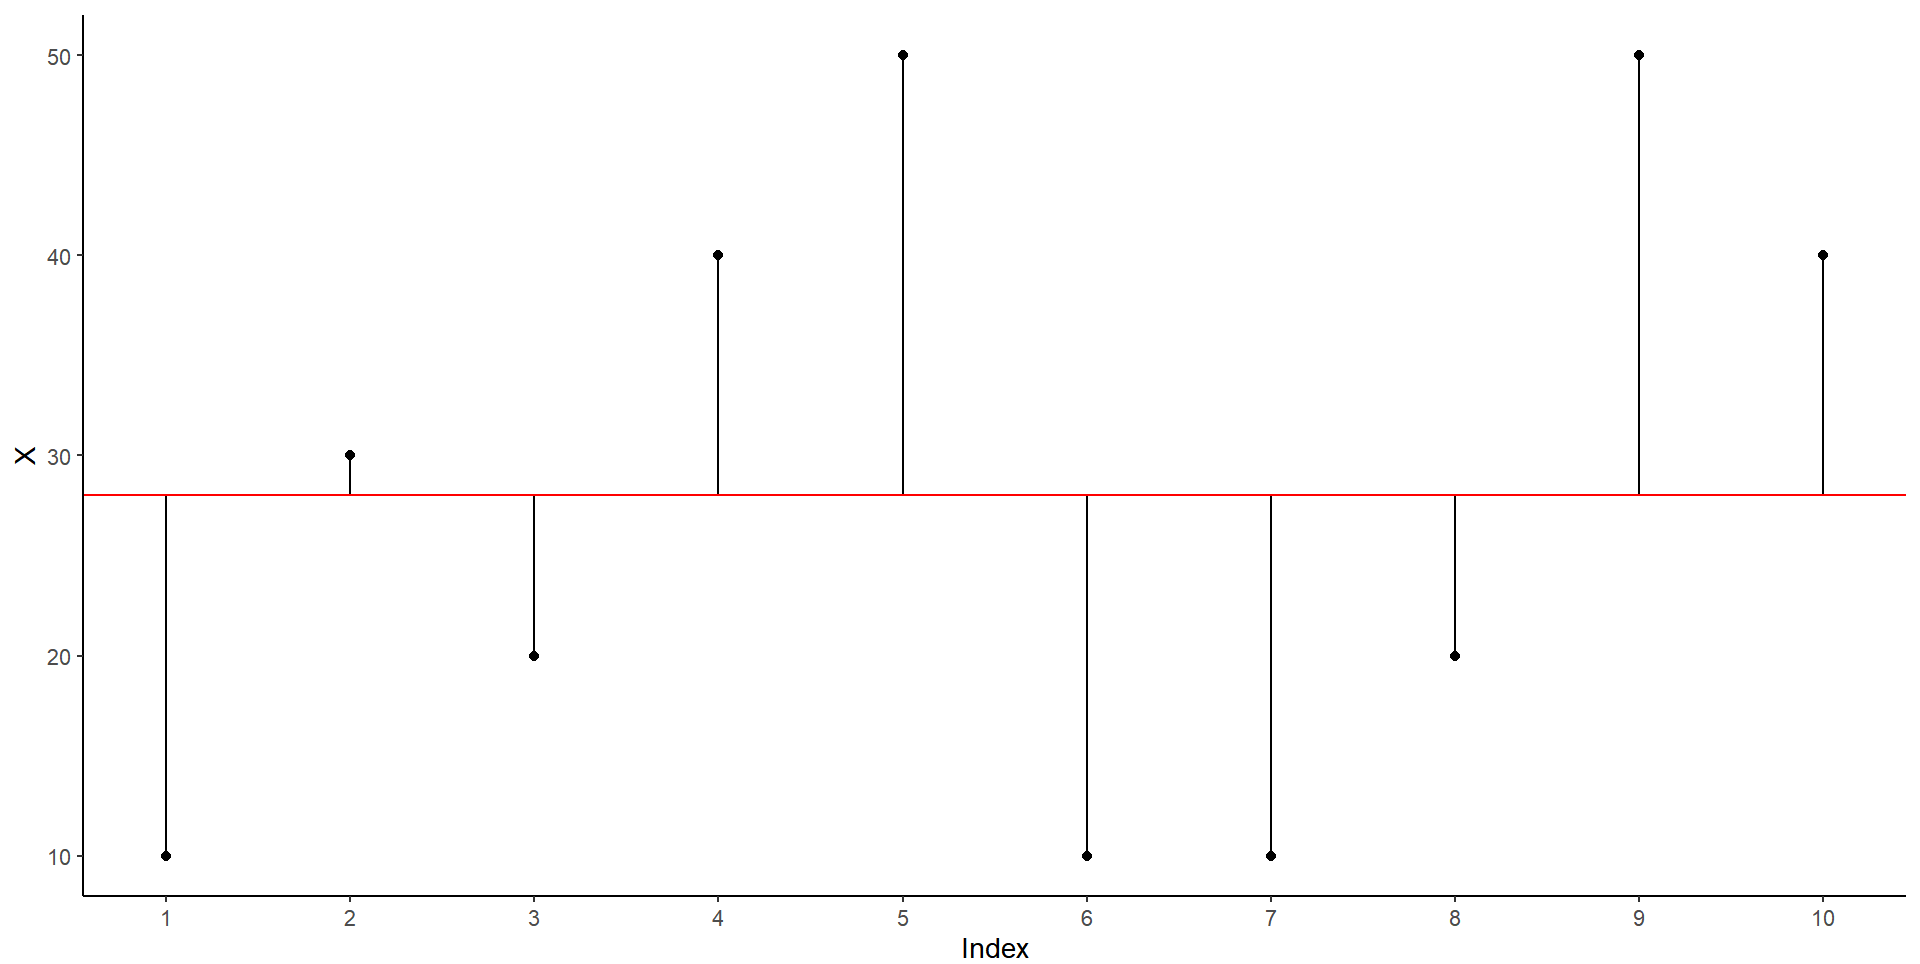
As the question states, I am looking for some warmup activities for teaching undergrads practical examples of variation and standardized distributions. I think the first part is relatively easy to teach. I was thinking of selecting a small random sample of students, picking out about 5 or 6 of their heights, then asking them if they think it represents the entire class. I would probably draw it on the board like below so it makes the data more "real" (the red line is the mean and the black dots are raw values):

enter image description here

However, I'm not sure if there are any practical examples for teaching standardization in class that immediately come to mind. I was thinking of taking two things that are on different scales and estimating their z scores in some way, but not sure if there is a more fun way of doing that. Are there any activities that you would recommend?

$\endgroup$
0

2 Answers 2

2
$\begingroup$

Maybe start with quantiles first. Those statistics are used often and make sense (growth charts is what comes to my mind, but maybe you can find something more engaging like statistics about TikTok videos).

The z-value is a statistic with a similar role as quantiles, but computed with the assumption that the underlying distribution is Gaussian distributed.

That assumption allows

  • To compute extreme quantiles with a large precision. With a small sample you can already ask questions about small probabilities that a particular student will be larger than some level.

    Although teaching this might be more difficult since predictions based on estimates have some complications. The next point is easier.

  • If distributions follow approximately a normal distribution, then reporting information about the distribution is easy and can be done by just giving mean and variancen (e.g. mean height and variance reported in some official table, although there are also tables that report additional quantiles).

    For given values of mean and variance one can use the z-distribution to compute questions about probability, e.g. how likely is it that a boy in the class will be above 190 cm?

$\endgroup$
2
$\begingroup$

Just to give you some basic ideas (if other things come to my mind I'll update the answer), I would show how standardization:

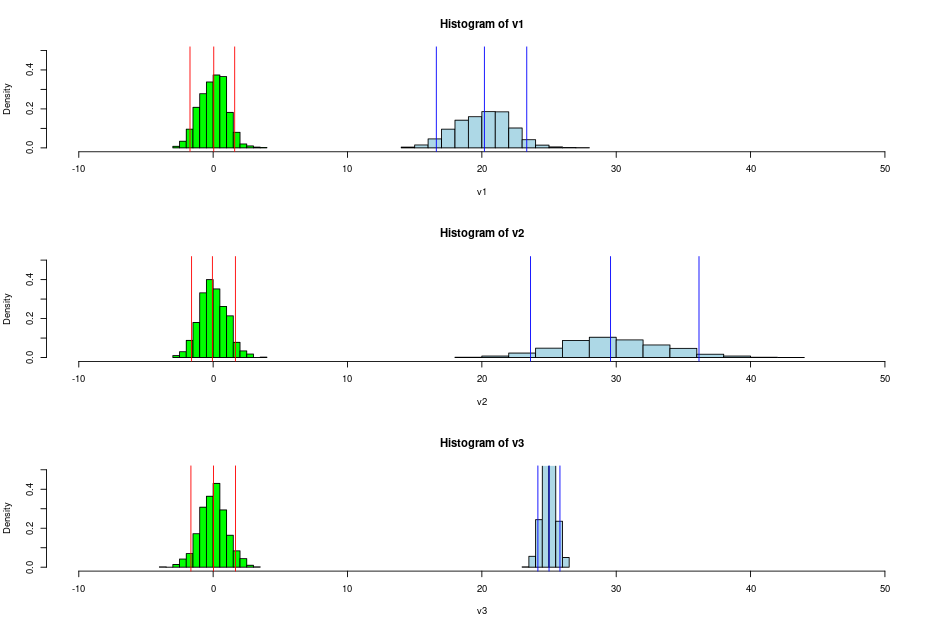
  • makes the distribution of different (normally distributed) variables similar to each other. See figure.
  • Preserves correlation but the covariance matrix is not the same (run code). You can show how this is justified by the corresponding formulas.

Apart from this, I suggest having a look on Teaching Statistics which is academic journal specialized in teaching statistics.

Code:

set.seed(123)

v1 <- rnorm(1000, mean = 20, sd=2)
v2 <- rnorm(1000, mean = 30, sd=4)
v3 <- rnorm(1000, mean = 25, sd=0.5)
cov(cbind(v1,v2,v3))
cor(cbind(v1,v2,v3))


s1 <- scale(v1)[,1]; s2 <- scale(v2)[,1]; s3 <- scale(v3)[,1]
cov(cbind(v1,v2,v3))
cor(cbind(s1,s2,s3))


par(mfrow = c(3, 1))
h1 <- hist(v1, plot = F)
hs1 <- hist(s1, plot = F)
h2 <- hist(v2,  plot = F)
hs2 <- hist(s2,  plot = F)
h3 <- hist(v3,  plot = F)
hs3 <- hist(s3,  plot = F)

plot(h1, col="lightblue", xlim=c(-10,50),ylim=c(0,0.5),freq = F)
abline(v = quantile(v1,probs=c(0.05, 0.5, 0.95)), col="blue",cex=2)
plot(hs1, col="green", add=T,freq = F)
abline(v = quantile(s1,probs=c(0.05, 0.5, 0.95)), col="red",cex=2)


plot(h2, col="lightblue", xlim=c(-10,50),ylim=c(0,0.5),freq = F)
abline(v = quantile(v2,probs=c(0.05, 0.5, 0.95)), col="blue",cex=2)
plot(hs2, col="green", add=T,freq = F)
abline(v = quantile(s2,probs=c(0.05, 0.5, 0.95)), col="red",cex=2)


plot(h3, col="lightblue", xlim=c(-10,50), ylim=c(0,0.5),freq = F)
abline(v = quantile(v3,probs=c(0.05, 0.5, 0.95)), col="blue",cex=2)
plot(hs3, col="green", add=T,freq = F)
abline(v = quantile(s3,probs=c(0.05, 0.5, 0.95)), col="red",cex=2)
$\endgroup$

Your Answer

By clicking “Post Your Answer”, you agree to our terms of service and acknowledge you have read our privacy policy.

Not the answer you're looking for? Browse other questions tagged or ask your own question.