11
$\begingroup$

I know that it is generally accepted that the two-sided test is the "Gold Standard". However, I just wanted to see if there are real life, practical applications of the one-sided test in the real world, or if this only exists in academia.

Edit: "Generally accepted / Gold Standard" in the sense of being the default recommendation in the book Introduction to Statistical Learning, 2nd ed., p.558, footnote 8:

A one-sided $p$-value is the probability of seeing such an extreme value of the test statistic; e.g. the probability of seeing a test statistic greater than or equal to $T$=2.33. A two-sided $p$-value is the probability of seeing such an extreme value of the absolute test statistic; e.g. the probability of seeing a test statistic greater than or equal to 2.33 or less than or equal to −2.33. The default recommendation is to report a two-sided $p$-value rather than a one-sided $p$-value, unless there is a clear and compelling reason that only one direction of the test statistic is of scientific interest.

$\endgroup$
28
  • 4
    $\begingroup$ "generally accepted that the 2 sided test is the Gold Standard", this is news to me, could you let me know where you read this? Also, I have to admit I'm not used to one-sided tests being viewed as academic; indeed I suspect many are more inclined to view 2-sided tests "trivial" if we had to pick one of the two :). A few standard situations where 1 sided tests are appropriate: a) I developed a new product and I want to test if it's better than the old b) I want to know if women in my organization are paid less than men c) I want to know if variation in my industrial process is increasing $\endgroup$ Commented Jan 24, 2023 at 19:48
  • 2
    $\begingroup$ I'm not sure that I would equate "Default Recommendation" with "Gold Standard" ;) Glad you found them useful $\endgroup$ Commented Jan 24, 2023 at 21:55
  • 2
    $\begingroup$ @Katsu I don't think there should be any "default recommendation" for either one- or two-sided p-values. People should be encouraged to think about what the scientific interest is in any situation. Tests and p-values have been recently criticised a lot for thoughtless mis- and overuse, and using "default recommendations" may well contribute to that. (Also statistical tests are around for much longer than the field of Machine Learning, and any ML book, "Bible" or not, shouldn't be considered a top authority on them.) $\endgroup$ Commented Jan 24, 2023 at 22:31
  • 4
    $\begingroup$ (And by the way most standard tests using F- and chi-squared distributions are normally used one-sided.) $\endgroup$ Commented Jan 24, 2023 at 22:32
  • 2
    $\begingroup$ In the defence of the biblical comparison, the authors of ISLR are Trevor Hastie, Robert Tibshirani, Daniela Witten, and Gareth James. Each has forgotten more statistics than I ever learned. It is an excellent book, has a 2nd edition, is freely available, and hence very prominent. This book is not unique in this recommendation. $\endgroup$
    – dimitriy
    Commented Jan 24, 2023 at 22:44

6 Answers 6

28
$\begingroup$

I would disagree that one-sided tests are academic and claim that they are more often used in industrial applications. Based on personal experience with journal referees, I would even go so far as to say that there is some bias against one-sided tests in (social science) academia. Most modern textbooks devote very little attention to them. There is some opposition in tech as well. There is a good list of pro and against examples here, going all the way back to Fisher's agricultural experiments in the 1930s. Equivalentce and non-inferiority tests in medical trials are another example.

While there is no firm boundary between science in academia and industry, the distinction is still useful. I suspect that academic science is more concerned with demonstrating the existence/nonexistence of relationships, which needs two sides. But industrial scientists focus more on directional questions, where one-sided makes more sense and is more efficient. Efficient here means allowing for more/shorter experiments, with quicker feedback on ideas. This efficiency comes at the cost of partially unbounded confidence intervals.

For practical advice, the question should determine the test:

  • Is A any different from B? $\rightarrow$ two-sided test.

  • Is A any worse/better than B? $\rightarrow$ one-sided tests.

Both tests should be combined with pre-registration, ex-ante power calculations, and robustness checks to be safe. Switching to one-sided to get significance after peeking at the data is a bad idea. There is also nothing wrong with running another experiment when you see an effect in the other, unexpected direction.

Questions or claims that produce two-sided tests tend to look like this:

  • Is there any relationship between Y and X? (existence)
  • X has no influence on Y whatsoever (nonexistence)
  • X has no relationship with Y (also nonexistence)
  • A is not any different from B (nonexistence again)

One-sided tests come from directional questions:

  • Is A better than B?
  • Is doing X worse than doing Y?
  • Is A better than B by at least k?
  • Is the change in Y associated with changing X less than m?

Here are two final examples from the business world.

  1. You are evaluating a marketing campaign for your company. You need the added revenue from advertising to exceed the cost of showing the ad. For the decision about launching the campaign, you don't care if the ad drives away customers; you would not launch it anyway. Quantifying the uncertainty about just how terrible the effect is wasteful.

  2. You are considering reducing the number of photos taken per product to lower photography costs and hosting expenses. You need to make sure that the dip in sales is smaller than the savings from shorter photoshoots.

$\endgroup$
1
  • 3
    $\begingroup$ Awesome answer. $\endgroup$
    – Katsu
    Commented Jan 25, 2023 at 0:10
9
$\begingroup$

I know its generally accepted that the 2 sided test is the Gold Standard

This is highly contextual at best; there are many statistical tests where only one-sided versions of this test are used (e.g., most tests of variance, ANOVA tests, chi-squared tests, etc.). I presume what you have in mind is the one-sided or two-sided test for something like a test of the mean where both variations exist and are in common use (see this related question and answer). Assuming this context, the reason that two-sided tests are generally preferred in this context is that one-sided tests sometimes occur when the analyst has used the data to first formulate a one-sided hypothesis, and this biases the test. Consequently, use of one-sided tests is sometimes viewed with scepticism and raises some immediate questions: Why did you choose to test that one-sided hypothesis instead of the other one? Was your choice of hypothesis affected by the data?

One of the curious and somewhat unfortunate properties of a classical hypothesis test is that the p-value cannot be compared rationally across different tests. In particular, when comparing a one-sided and two-sided version of the test, the same evidence in favour of the (one-sided) hypothesis will give a p-value that is half as much in the one-sided test as in the two-sided test. This means that, if you were to compare p-values across the two tests, the evidence appears to be stronger for the narrower hypothesis, which is of course absurd. This means that hypothesis tests do not follow the kinds of desiderata we would like them to when you compare across tests, which means we have to be very careful when choosing and interpreting tests. For this reason, I tend to take a hard line on this issue and require that you should always use the two-sided version of tests of this kind (i.e., tests which have a natural one and two-sided version). Other statisticians are more liberal on this issue and may be satisfied with a one-sided test if they are confidence that the choice of the side was made a priori and was not affected by the data.

$\endgroup$
7
$\begingroup$

One sided significance tests are useful most of the time that you want an index of the strength of evidence in the data against the null hypothesis according to the statistical model. That is to say, most of the time that a significance test might be used. That means that practical examples abound, even where they mostly illustrate how two-sided testing is used where one-sided is at least as appropriate. People frequently use P-values from two-sided tests because they are expected to do so, not because one sided tests are inappropriate.

Standard arguments in favour of two-sided testing are almost exclusively relevant to hypothesis testing, not significance testing. If you are unsure why I would draw a distinction between hypothesis testing and significance testing then you should start reading about that before you try to sort out the number of tails you should be testing against. See this question for a good start: What is the difference between "testing of hypothesis" and "test of significance"?

When you are thinking about the evidential meaning of data according to a statistical model it is natural to look at likelihood functions, and indeed there is a one to one relationship between significance test-derived P-values and likelihood functions. Two-sided P-values point to likelihood function that are bimodal whereas the natural interpretation of evidence would yield unimodal likelihood functions from those same data. The one-sided P-value is the index to those unimodal likelihood functions. See here for a full explanation of the relationship between P-values and likelihood functions: https://arxiv.org/pdf/1311.0081.pdf

This chapter explains the distinction between significance tests and hypothesis tests and how P-values can be used to support scientific inferences: https://rest.neptune-prod.its.unimelb.edu.au/server/api/core/bitstreams/1d20d0cb-f3d3-5e23-be16-c20b735f8568/content

$\endgroup$
7
$\begingroup$

The F-test in a traditional ANOVA is (and should be) one-sided.

(This is not to be confused with using an F-test to compare two group variances, analogous to using a t-test to compare two group means. Such an F-test could be very reasonable.)

Loosely speaking, ANOVA assesses if the variance between the group means overwhelms the variance within the data overall. That is, we care if the "between" variance is greater than the "within" variance. If the "between" variance is less than the "within" variance, then that provides no evidence in favor of our alternative hypothesis that "between" variance is greater than "within" variance.

Consequently, we only look at one side of the F-distribution to calculate the p-value.

$\endgroup$
5
$\begingroup$

Some Scenarios

I wanted to focus on one particular part of your question:

I just wanted to see if there are real life, practical applications of the 1 sided test in the real world

Here are some practical examples:

  • "Is my company's starting salary larger than a rival company?"
  • "Do students at my school receive less student aid than other schools?"
  • "Are people from my graduating class taller than other classes before me?"

These are all questions that can be answered by one-sided tests. However, this is also where hypothesis testing is very important. Using the first example, we may have a litany of informal evidence that seems to suggest salaries are greater at another company (feedback from employees there, bigger offices at their company, etc.). Rather than just asking ourselves "are their salaries different from ours?" an easier question to answer may be the one already posed: are they higher? Knowing this information would be super useful if you decided to change companies down the road.

Remember that your chances of rejecting the null hypothesis in one direction increase as a result of how big the tail is compared to a two-tailed test, with the caveat that you can only test one region. Recall that a two-tailed rejection region is larger than a one-tailed region:
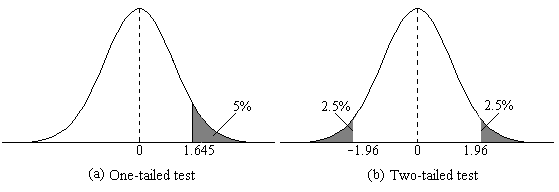
enter image description here

Having a strong idea of what the outcome should be ensures that this test answers your question in a more direct way than a two-tailed test.

Practical Example Using R

To simulate this specific scenario, I have created two normally distributed "salary" values for two banks: Bank of America (BOA) and CitiBank. Adjusting their means to only be slightly divergent, we can then test this with a t-test using a one-tail test.

#### Simulate Groups ####
set.seed(123)

group.1 <- rnorm(n = 1000,
                 mean = 100000,
                 sd = 10000)

group.2 <- rnorm(n = 1000,
                 mean = 120000,
                 sd = 5000)

df <- data.frame(CitiBank = group.1,
                 BOA = group.2)

#### Test Groups ####
t.test(group.2,
       group.1,
       alternative = "greater")

And you can see the test is significant:

    Welch Two Sample t-test

data:  group.2 and group.1
t = 56.98, df = 1484.2, p-value < 2.2e-16
alternative hypothesis: true difference in means is greater than 0
95 percent confidence interval:
 19471.87      Inf
sample estimates:
mean of x mean of y 
 120212.3  100161.3 

However, if we plot the critical cutoff zones used for a two-tailed test and compare them to a one-tailed test:

#### Plot ####
library(tidyverse)
library(ggpubr)

p1 <- df %>% 
  gather() %>% 
  ggplot(aes(x=value,
             fill=key))+
  geom_density(alpha = .5,
               linewidth = 1)+
  theme_classic()+
  scale_fill_manual(values = c("black","white"))+
  geom_vline(aes(xintercept = mean(group.1)),
             color = "red",
             linetype = "dashed",
             linewidth = 1)+
  geom_vline(aes(xintercept = mean(group.2)),
             color = "red",
             linetype = "dashed",
             linewidth = 1)+
  geom_vline(aes(xintercept = mean(group.1) + 1.96*sd(group.1)),
             color = "blue",
             linetype = "dashed",
             linewidth = 1)+
  geom_vline(aes(xintercept = mean(group.1) - 1.96*sd(group.1)),
             color = "blue",
             linetype = "dashed",
             linewidth = 1)+
  labs(x="Salary",
       y = "Density",
       fill = "Group",
       title = "Salary Comparison with Two-Tailed Test")+
  scale_x_continuous(n.breaks = 10)

p2 <- df %>% 
  gather() %>% 
  ggplot(aes(x=value,
             fill=key))+
  geom_density(alpha = .5,
               linewidth = 1)+
  theme_classic()+
  scale_fill_manual(values = c("black","white"))+
  geom_vline(aes(xintercept = mean(group.1)),
             color = "red",
             linetype = "dashed",
             linewidth = 1)+
  geom_vline(aes(xintercept = mean(group.2)),
             color = "red",
             linetype = "dashed",
             linewidth = 1)+
  geom_vline(aes(xintercept = mean(group.1) + 1.645*sd(group.1)),
             color = "blue",
             linetype = "dashed",
             linewidth = 1)+
  labs(x="Salary",
       y = "Density",
       fill = "Group",
       title = "Salary Comparison with One-Tailed Test")+
  scale_x_continuous(n.breaks = 10)

ggarrange(p1,p2, ncol = 1)

You will get these plots:
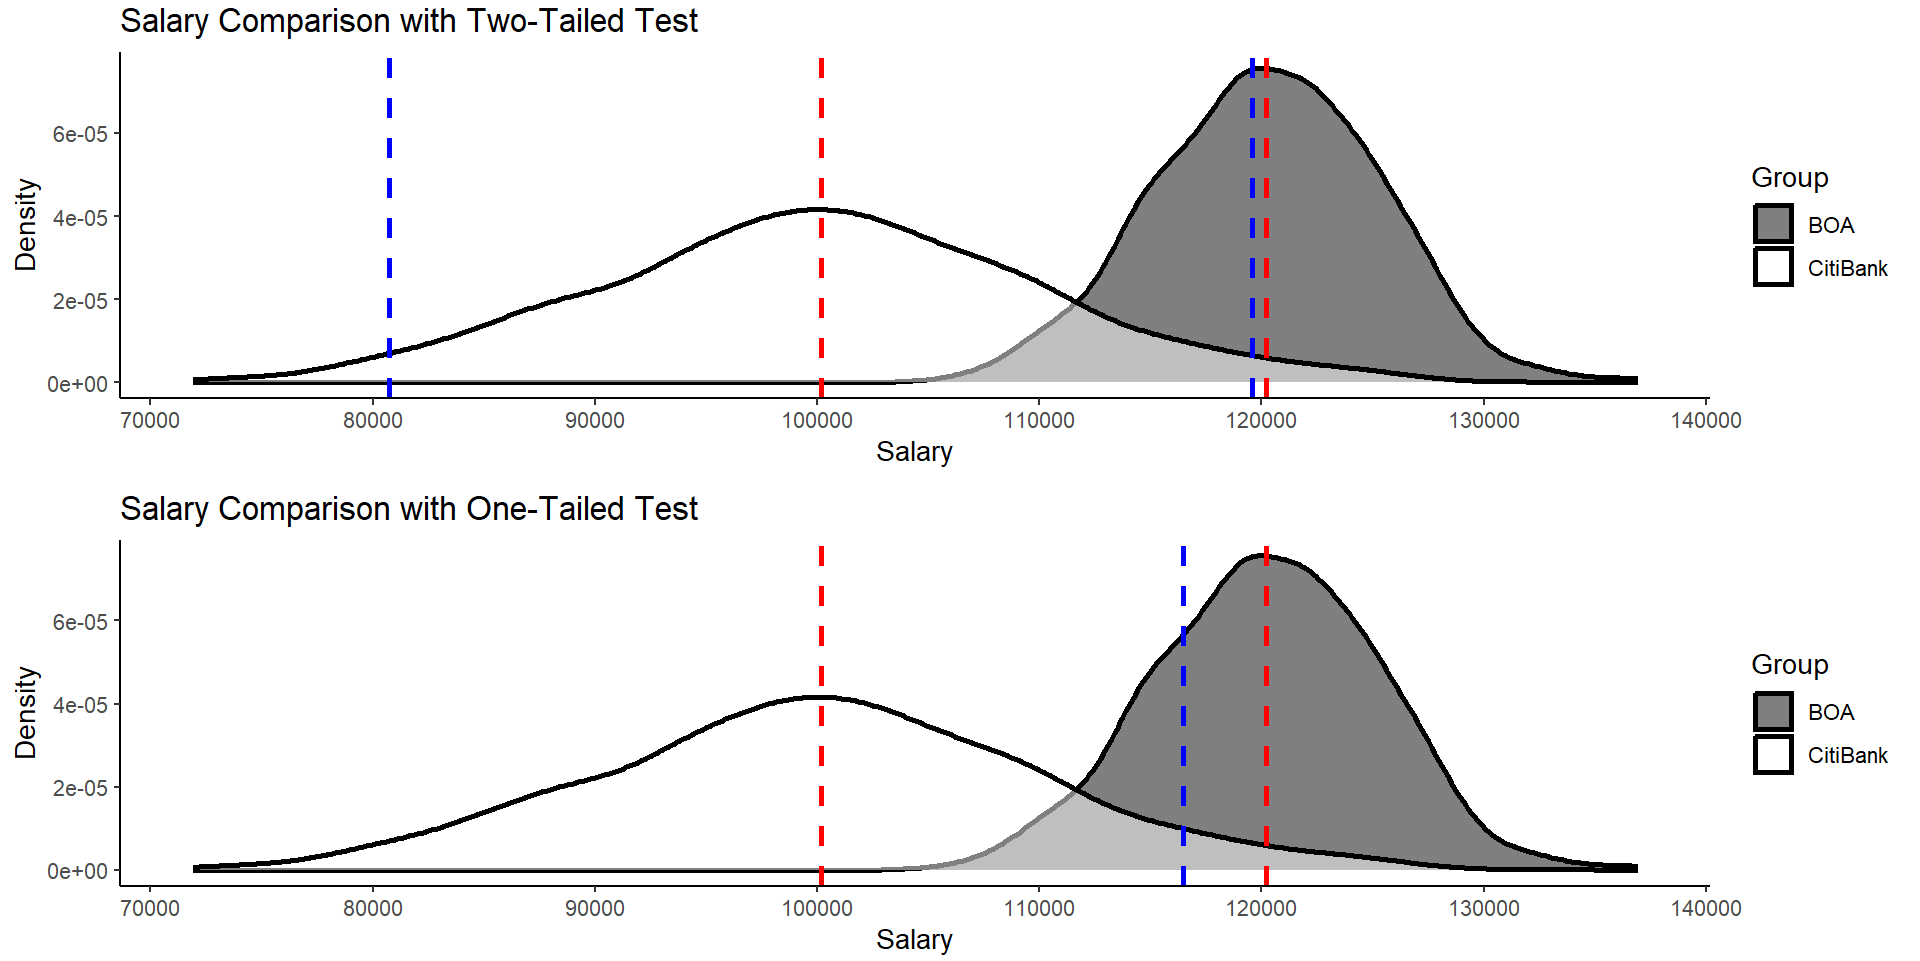
enter image description here

The red dashed lines are the means of each group and the blue dashed lines are the critical regions to reject the null. The plot on top shows cutoffs for the two-tailed test whereas the plot on the bottom shows a one-tailed test. You can see that for the two-tailed test we barely pass the cutoff criterion. However, we have far surpassed it in the one-tailed case.

You can see clearly that Bank of America pays more. If you were to make a judgement call about which bank to work for, which would you choose? A two-tailed test may have given you a misfire if the means were slightly different from each other. This should highlight the practicality of the test as well as why strong hypotheses are helpful to answering these questions.

$\endgroup$
2
  • $\begingroup$ Great example! However, you also have to consider that the one sided test is more lax, so we should only use it for cases where Type 1 errors are not that serious. $\endgroup$
    – Katsu
    Commented Jan 26, 2023 at 4:04
  • 1
    $\begingroup$ I think that assumption is correct as well. $\endgroup$ Commented Jan 26, 2023 at 4:13
0
$\begingroup$

The entire "framework" of testing non-inferiority and clinical superiority in clinical trials makes a perfect example.

Traditionally, these tests are performed via confidence intervals, by observing whether the lower bound crosses some threshold. We are completely NOT interested in the upper bound. Thus we use single-sided confidence interval, being equivalent to a one-sided statistical test (they are dual to each other, they must agree in indicating statistical significance).

What's the purpose of non-inferiority testing? It's common when examining a new drug or therapy. You want to know if the active drug performs no worse than the control - the current standard of care - and no more than some accepted margin. You do accept that the new treatment may perform a bit worse, while offering other benefits (works faster, fewer adverse reactions = safer, easier and/or rarer administration). You say then: "Of course I want the new drug to be efficient and safe, but initially it suffices to me that it performs not-much-worse than the current one, say no more than -10 percentage points".

Then you assess the difference in some estimate (chosen by you) between the two drugs and calculate the confidence interval around. You accept that the CI may not exclude 0, but also agree that it won't exclude some negative difference, only not too big.

So, if your non-inferiority threshold was -10% points, and your single-sided confidence interval is [-8pp - 100pp], then you reject the null hypothesis about inferiority and claim non-inferiority (be careful - these hypotheses are "reversed"). If it's [-11pp - 100pp], then you cannot reject inferiority.

Same about clinical superiority. Now, instead of laying above the non-inferiority threshold, you look whether it lies above 0 (or 1 for ratios).

$\endgroup$

Your Answer

By clicking “Post Your Answer”, you agree to our terms of service and acknowledge you have read our privacy policy.

Not the answer you're looking for? Browse other questions tagged or ask your own question.