The problem I have is that I have several groups (say 3 to make discussion concrete) with observations from a true but known distribution $p^*_1, p^*_2, p^*_3$ (or 3 populations). I can compute some metric from the data form the groups, usually some sort of expectation (mean) [e.g. average loss, cost, accuracy, error, distance between points, etc.] but the means are not comparable across groups and I want them to be comparable (for a potential hypothetical reason if it's an accuracy then a value of 0.9 in one data set might not be comparable with 0.6 on an "easier: data set).
Concretely, what I want is to be able to create a table with these 3 metrics from the 3 groups and be able to read off which one has "better" values compared to the others e.g.:
| Group Mean Name | Numeric comparable Mean |
|---|---|
| comparable mean0 | 0.0 |
| comparable mean1 | 0.1 |
| comparable mean2 | 0.2 |
| comparable mean3 | 0.3 |
How do I do this i.e. "normalize" the statistics in different groups such that they are comparable, at least if they are portrayed in the same table. Ideally if they are "absolutely comparable" that would be best.
Current Thoughts/Attempts
Some notation: $group1 = \{(x_i, y_i)\}^{N_1}_{i=1}, group2 = \{(x_i, y_i)\}^{N_2}_{i=1}, group3 = \{(x_i, y_i)\}^{N_3}_{i=1}$ where $y$ can just be $x$ (e.g. self supervised ML/SSL).
The first native idea I thought off is of googling some sort of generalization of cohen's d (effect size). I thought of this because I noticed from it's equation that the difference of means from each distribution was divided by some sort of smart weighted aggregation of the standard deviations of the two distributions (pool std):
$$ d = \frac{\bar{x}_1 - \bar{x}_2}{\sqrt{\frac{(n_1-1)s_1^2 + (n_2-1)s_2^2}{n_1 + n_2 - 2}} / \sqrt{n_1 + n_2 - 2}} $$
I thought of dividing any pair-wise distance between the 3 group means by the aggregation of some 3 group mean std, but realized this didn't make the mean into a comparable mean but instead it made the distance comparable. The comparison also scaled quadratically -- instead of linearly compared to normalizing some values into a table. In addition, it felt made up so I don't know if this makes sense at all. It also doesn't lead to absolute comparison.
With a little bit more googling this seems to be very similar to the so called Hedge's g (and g*). I wasn't really convinced this was different enough to cohen's d to be useful to me. Plus I think I'd prefer something that doesn't need effect size explicitly and can be linearly "obvious" from reading a table (if possible! but a decision procedure that print how similar different pairs is might be better than nothing, in that case what would be the official way to use my suggested extension of cohen's d or Hedge's g to compare the means?).
After thinking about it more I thought of another approach. Since I can't center the mean using the mean (duh), let's center the data and then compute the mean. i.e.
z_A = E[(A_i - meanA) / sA]
z_B = E[(B_i - meanB) / sB]
z_C = E[(C_i - meanC) / sC]
# where E is the expectation or empirical expectation operator
this feels similar to compute z-values. Which might be all I need. But it feels weird because usually the z-score says:
Technically, Z-score tells a value (x) is how many standard deviations below or above the population mean (µ). so the right thing feels to compute the z-score for a specific sample mean for the group...but I need the sample mean (and std) to do this (itself basically), so I wasn't happy. Is there a way to fix this? Perhaps splitting the data in the group into two to compute the sample mean to compute the statistics for the z-distribution and then the other to sample a sample mean to put into that distribution and get a z-score? (if this is possible switching it to t-scores should be easy. In my case I'm running simulations so I can get large N's e.g. 1000 is not too bad to get >2hours).
I do want to say I am not completely ignorant that it seems implicitly ANOVA should be might be able to compute this "comparable statistics of means". I say this because I am aware that ANOVA at an "API" level tests the following hypothesis (for 3 groups for easy of exposition):
H0: mean0 = mean1 = mean2 = mean (mean is an unspecified mean)
H1: all alternative hypothesis/differences
therefore, I assumed that perhaps the score it uses underneath might be of use. I've skimmed Hogg's, McKean's, Craig's Introduction to Mathematical Statistics on the ANOVA section derivation and it seems it will require much more substantial concentration + time to fully understand if the F-distribution is what I need. I suspect it might be of help but I am not sure. Also, ANOVA uses p-values and significance levels so for large N I am aware due to how specific the H0 (null) is it might always detect a difference, hence the actual statistical test is not what I really need. I just need to be able to force ANOVA to give me the comparable means I need. Then it's up to me to determine an interpretation (I suppose). I suppose it wouldn't hurt to know if the means are statistically/practically different with pair-wise hedge/cohen's effect size with 3 stds pooled but I'd like to be more granular on the difference (than testing such a strong hypothesis of all equality). In addition, the table I reference with "F-distribution scores" (made up name) might be all I really need.
To complicate things, since I realized I wanted to sort of "normalize and center the mean" I thought that perhaps I could use higher order moments e.g. compute the 1st moment subtract the 2ths and divide by 4th (attempting to normalize and center the mean). Anyway, sounds super made up.
Or perhaps some clever extension of R^2 is what I need but I need to think more.
I suppose due to the existence ANOVA that this might be a solved problem, so how do I extract the comparable statistics (relative or absolute) that I want?
One last thought is if different accuracies are considered and data sets have different complexities trying to estimate this complexity and take it into account in the computation could work...
Not sure anymore if the f-statistic will do what I need. Or the z-score I suggested by splitting the big groups of data I have will work. Because if the data is large, wouldn't the two means be relatively close? So it won't tell me the normalized value of the mean for group1 that I want.
Comments on metrics distribution
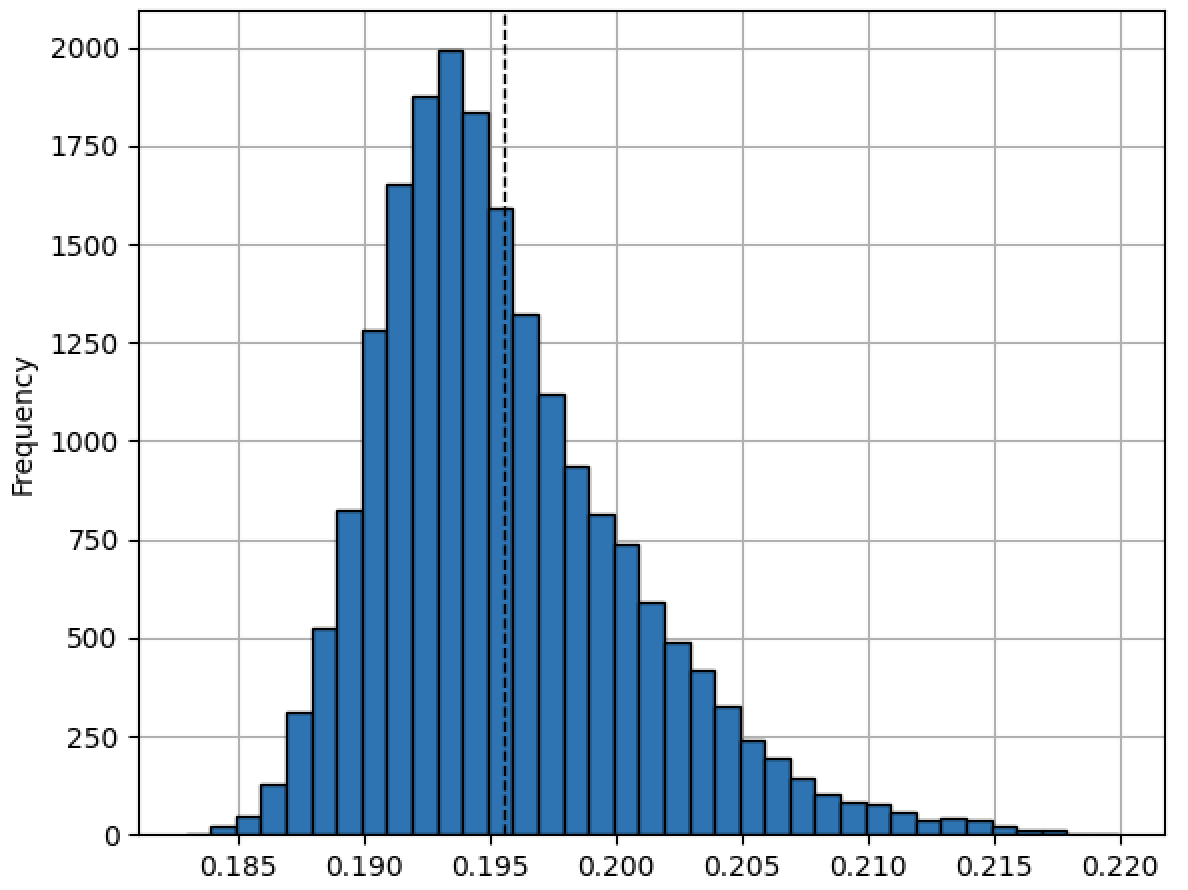
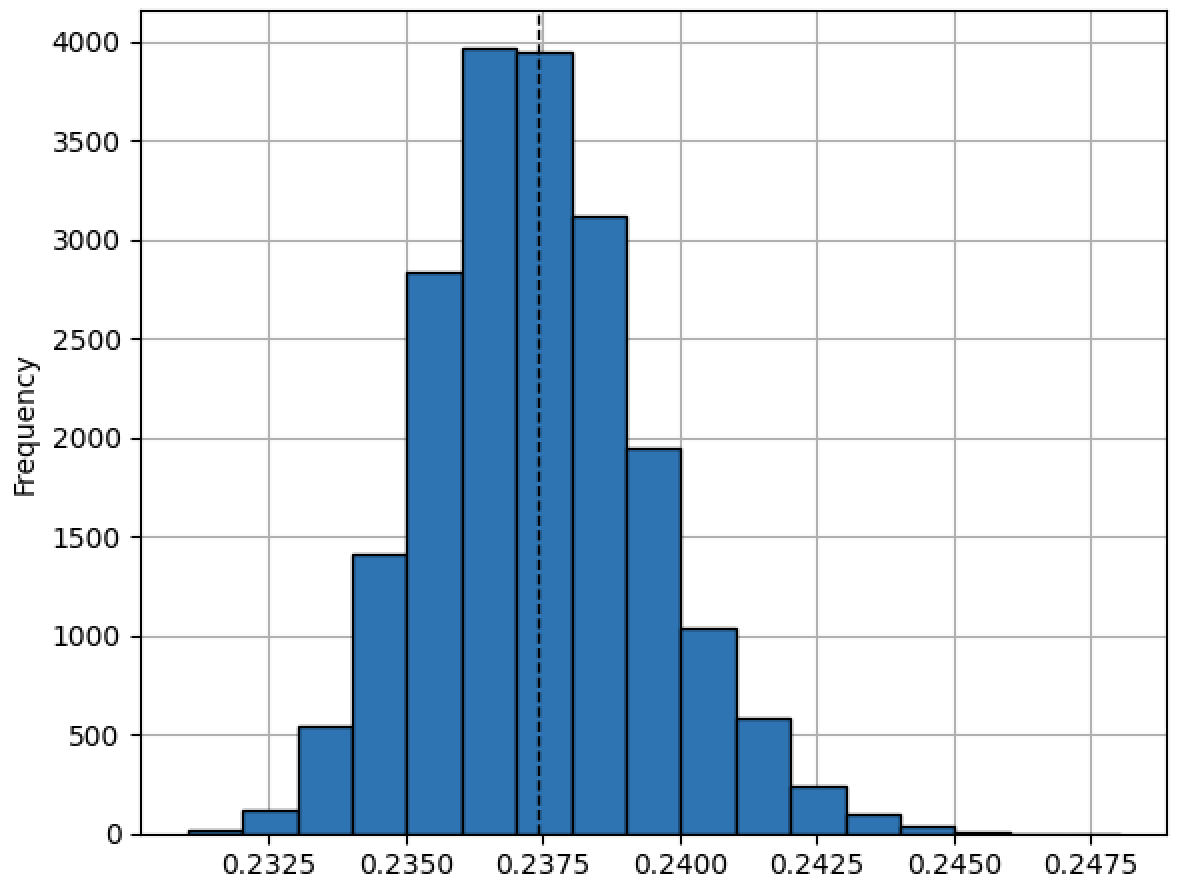
It will take me a bit of time to write something concise, coherent, with nice plots. But a tldr: answer is that the metrics in question when plotted look very normal/Guassian.
Some plots for now:
Using the t-test (or z-test)
I am thinking that the t-test implicitly uses a way to put the data in a standard normal. e.g. when computing the p-values in python it returns the t-statistic:
import scipy.stats as stats

sample1 = data1  # the first sample data
sample2 = data2  # the second sample data

t_statistic, p_value = stats.ttest_ind(sample1, sample2)
can't the t-statistic be used for what I want? A normalized value for mean by doing sample1 = smaple2 = data1 and then doing sample1 = smaple2 = data2?
related:
- related, standardizing complexity of a task: https://github.com/awslabs/aws-cv-task2vec/issues/16
- cross reddit ask stats: https://www.reddit.com/r/AskStatistics/comments/10tu4qa/how_does_one_create_comparable_metrics_when_the/
- cross quora: https://www.quora.com/unanswered/How-does-one-create-comparable-metrics-when-the-original-metrics-are-not-comparable
- cohen's d vs hedge's but it uses pairwise comparisons: Difference between Cohen's d and Hedges' g for effect size metrics
- cross reddit statis: https://www.reddit.com/r/statistics/comments/10tu71o/research_how_does_one_create_comparable_metrics/


