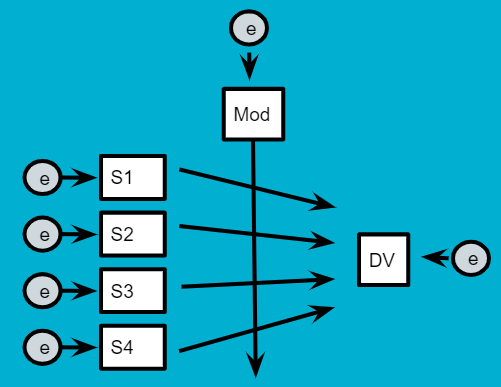
I'm trying to simulate what is essentially a multiple linear regression for MASEM with some interaction terms. The idea is to have something like this:
In this model, the S variables are all likely correlated and I'm assuming that the mod variable is not correlated with the S variables, but I have included it's covariance in the model just in case there is some relation. However, I specifically want to test if the mod variable has interactions with the S -> DV regression paths. I've drawn one singular line for simplicity, but "Mod" should regress on each S -> DV path here. All of these variables should be numeric values. Also, the S variables are all positively associated with DV, but Mod is negatively associated with DV. However, I'm not sure yet if I can directly test this for my model, so for now I simply included it as a another regression path in the path analysis. Also, while the S variables are related, I explicitly label them as manifest because I want to directly test the interactions for each variable rather than a single latent variable path.
I've tried simulating this model by using this data:
#### Load Libraries ####
library(lavaan)
library(tidyverse)
library(semPlot)

#### Sim Data ####
set.seed(123)
DV <- rnorm(n=1000)
S1 <- DV *.40 + rnorm(n=1000)
S2 <- DV *.40 + rnorm(n=1000)
S3 <- DV *.40 + rnorm(n=1000)
S4 <- DV *.40 + rnorm(n=1000)
MD <- DV * -.40 + rnorm(n=1000)
df <- data.frame(S1,S2,S3,S4,MD,DV) %>%
  as_tibble()
df
Then I fit the model in lavaan:
#### Model Preds ####
model <- "
DV ~ a*S1 + b*S2 + c*S3 + d*S4 + e*MD
INT1 := a*e
INT2 := b*e
INT3 := c*e
INT4 := d*e
"

#### Fit Model ####
fit <- sem(model,
           df)

#### Plot Model ####
semPaths(fit,
         whatLabels = "std",
         style = "lisrel",
         curve = 2,
         residScale = 10,
         edge.label.cex = .8)
But the path model doesn't look correct...it shows covariances with all of the predictors but it doesn't appear to model the interactions in the plot from what I can see.
However, running summary(fit, standardized = T), it appears to have at least some part showing the interactions I modeled at the end of the summary:
lavaan 0.6-12 ended normally after 1 iterations

  Estimator                                         ML
  Optimization method                           NLMINB
  Number of model parameters                         6

  Number of observations                          1000

Model Test User Model:

  Test statistic                                 0.000
  Degrees of freedom                                 0

Parameter Estimates:

  Standard errors                             Standard
  Information                                 Expected
  Information saturated (h1) model          Structured

Regressions:
                   Estimate  Std.Err  z-value  P(>|z|)   Std.lv
  DV ~
    S1         (a)    0.223    0.022   10.129    0.000    0.223
    S2         (b)    0.191    0.023    8.341    0.000    0.191
    S3         (c)    0.218    0.022    9.747    0.000    0.218
    S4         (d)    0.217    0.022    9.789    0.000    0.217
    MD         (e)   -0.222    0.022   -9.951    0.000   -0.222
  Std.all

    0.251
    0.202
    0.234
    0.239
   -0.241

Variances:
                   Estimate  Std.Err  z-value  P(>|z|)   Std.lv
   .DV                0.535    0.024   22.361    0.000    0.535
  Std.all
    0.545

Defined Parameters:
                   Estimate  Std.Err  z-value  P(>|z|)   Std.lv
    INT1             -0.050    0.006   -7.747    0.000   -0.050
    INT2             -0.043    0.006   -6.806    0.000   -0.043
    INT3             -0.048    0.007   -7.134    0.000   -0.048
    INT4             -0.048    0.007   -7.263    0.000   -0.048
  Std.all
   -0.061
   -0.049
   -0.056
   -0.057
Is this correctly modeled? Or am I doing something wrong here? And can I include these interactions without regressing the Mod variable on DV?


