1
$\begingroup$

The goal of simulation is to produce a number of synthetic datasets, where the outcomes are a function of the known regression coefficients. I would like to know if my reasoning behind creating synthetic data is valid.

The steps involved are:
STEP 1: Based on the true (observed) data, fit GLM (e.g., gamma family).
STEP 2: Make a synthetic predictors.
STEP 3: Based on the output from STEP 2 and the fitted or predict function in R, obtain the expected outcome.
STEP 4: Based on the expected outcome, get the estimated shape and scale parameters (based on E(X) and Var(X)).
STEP 5: Obtain simulated outcome using the rgamma function in R.
STEP 6: Combine the output from STEP 5 and the synthetic predictors from STEP 2 to obtain the full simulated data.

In this manner, I am able to generate a synthetic dataset with the same dimension as the true (observed) dataset. However, I am wondering if this is a right way and if I can (or need to) remove STEP 4 - 6.

$\endgroup$

1 Answer 1

0
$\begingroup$

Edits:

Simulating data from a observed dataset is pretty straightforward. You have just to specify your regression coefficients. Unless, I miss something, but you don't need to predict anything. Indeed, if you have already observed data you can directly build your synthetic data on it.

I give you some code to illustrate what I am talking about.


set.seed(1234)
#First option: Simulating data with regression coefficients
X = rgamma(1000,shape=2) #X can be your observed data or your simulated ones

synthetic = rgamma(1000, shape=exp(1.2*X+rnorm(1000, 0,1)) #Here we assume a log link for a gamma distribution, while putting gaussian noise

summary(glm(synthetic~X, family=Gamma(link="log"))) #Should give you B1 close to 1.2

#Second option: Simulate data corresponding to your observed dataset
observed = rgamma(1000, shape=5)+ rnorm(1000, 0, 0.2) #I added some gaussian noise 

intercept.only = summary(glm(observed~1, family=Gamma(link="identity")))

#The parameters needed to simulate "synthetic" data
shape = intercept.only$coefficients[1,1]
dispersion = intercept.only$dispersion

#Simulate data with your estimates
simulated = rgamma(1000, shape=shape)

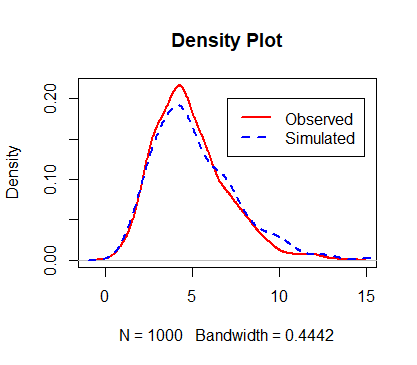
#Compare observed density to simulated one
plot(density(simulated), col="red", lty=1, lwd=2, main="Density Plot")
lines(density(rgamma(1000, shape=s.intercept.only$coefficients[1,1])), col="blue", lty=2, lwd=2)
legend(7,0.2, legend=c("Observed", "Simulated"), col=c("red", "blue"), lty=1:2, lwd=2)

However, if you want to mimic observed data while adding some noise within, predict data as you suggest should be an option. It will be pretty the same thing that estimating new data with observed data parameters like I initially suggested. Anyway I provided the two solutions.

Hope this helps. enter image description here

$\endgroup$
2
  • $\begingroup$ Hi @Mangnier Loïc. Thanks for the reply! Indeed, this is quite different from what I wanted to do. My ultimate goal is to obtain the complete synthetic data (outcome + predictors), assuming that the outcome follows a gamma distribution but is affected by the predictors simultaneously. That is, the outcome needs to be represented by a linear function of predictors, but with a log link. $\endgroup$
    – KLee
    Commented Feb 27, 2023 at 15:23
  • $\begingroup$ From What I understand to your initial post, you tend to overthink your problem. I suggest something easier. If I miss again the point, please let me know I will update my post. $\endgroup$ Commented Mar 1, 2023 at 18:55

Your Answer

By clicking “Post Your Answer”, you agree to our terms of service and acknowledge you have read our privacy policy.

Not the answer you're looking for? Browse other questions tagged or ask your own question.