1
$\begingroup$

Background

The lecturer of statistical computing asked such a question in title. To be specific, the population distribution is $$ f(x_1, \cdots, x_p) = \left(x_1^{p-1} + \cdots + x_p^{p-1}\right)I(0<x_i<1,\forall 1\le i\le p) $$ The theory of drawing an approximate sample is conditional distribution. $$ f(x_1, \cdots, x_p) = f_1(x_1) f_2(x_2 | x_1) f_3(x_3|x_2, x_1) \cdots f_p(x_p | x_{p-1}, ..., x_1) $$ We need to calculate marginal density which has been given to derive each entry above. $$ f(x_1, \cdots, x_j) = \left(x_1^{p-1} + \cdots + x_j^{p-1}\right) + \frac{p-j}{p} $$ which implies for every $j$, $$ f_j(x_j|x_{j-1},...,x_1) = \frac{f(x_j,..., x_1)}{f(x_{j-1}, .., x_1)} $$ Let's just skip the annoying calculations and give the sampling procedure directly.

  1. generate $U_1, R_1 \sim U(0,1)$ dependently, let $x_1 = U_1^{\frac1p}$ if $R_1 \le \frac1p$ else $x_1 = U_1$
  2. given $x_1$, generate $U_2, R_2 \sim U(0,1)$, let $x_2 = U_2^{\frac1p}$ if $R_2 \le \frac1{px_1^{p-1}+p-1}$ else $x_2 = U_2$,
  3. given $(x_1, ..., x_{j-1})$, generate $U_j, R_j \sim U(0,1)$, let $x_j = U_j^{\frac1p}$ if $R_j \le \frac1{p\sum_{i=1}^{j-1}x_{i}^{p-1}+p-j+1}$ else $x_j= U_j$, for $3\le j \le p$.

Simulation

Let $p=5$,

## R code
p <- 5
n <- 1e4
set.seed(1)
## generate a vector ~ F with dim p
generateVector = function(p) {
  vec = c()
  for (i in 1:p) {
    point = 1 / (sum(p * (vec ^ (p - 1))) + p - i + 1)
    threshold = runif(1)
    if (threshold < point) {
      vec = c(vec, (runif(1) ^ (1 / p)))
    } else{
      vec = c(vec, (runif(1)))
    }
  }
  return(vec)
}

dta <- data.frame()
for (i in 1:n) {
  dta <- rbind(dta, generateVector(p))
}
colnames(dta) <- paste0('x', 1:p)
head(dta)
x1  x2  x3  x4  x5 \
0.3721239   0.9082078   0.8983897   0.6607978   0.0617863 \
0.1765568   0.3841037   0.4976992   0.9919061   0.7774452 \
0.2121425   0.1255551   0.8266908   0.8250891   0.3403490 \
0.5995658   0.1862176   0.6684667   0.1079436   0.4112744 \
0.6470602   0.5530363   0.7893562   0.8624731   0.6927316 \
0.8612095   0.2447973   0.6302822   0.5186343   0.4068302

My question is how to verify the data dta is indeed a sample from $f$ by visualization when $p=5$ or is there any hypothesis test help?

If $p=1$, we can do that by plot histogram and add the density function curve to it, and apply $\chi^2$ test or Kolmogorov test.

$\endgroup$
4
  • $\begingroup$ Note that generally statistical model assumptions are arguably never precisely fulfilled (particularly not for pseudo-random numbers generated by a computer; these are called "pseudo random" for a reason). So there is no way to "verify" such an assumption. The best you can ever achieve is to come up with something that can distinguish data fitted clearly badly by your model from data that, in certain respects, look similar to data generated by the model. $\endgroup$ Commented Mar 17, 2023 at 16:31
  • $\begingroup$ @ChristianHennig, so it suffices to check that the sample data may follow the desired distribution with a relatively high probability. On that base we can continue to do some other statistical inference with the assumption the data obeys the distribution (say $f$ in the context of my post)? $\endgroup$
    – Chia
    Commented Mar 22, 2023 at 6:52
  • 1
    $\begingroup$ "so it suffices to check that the sample data may follow the desired distribution with a relatively high probability" - I'd say this probability is zero. Probability models such as distributions are idealisations, they never hold precisely in reality. To say that "theoretical assumptions need to be fulfilled in reality" is misleading. We do statistical inference all the time in situations in which assumptions are not fulfilled. What is important is that they are not violated in such a way that results are misleading. $\endgroup$ Commented Mar 22, 2023 at 10:14
  • $\begingroup$ I wrote more on this here: stats.stackexchange.com/questions/538561/… $\endgroup$ Commented Mar 22, 2023 at 10:14

2 Answers 2

1
+50
$\begingroup$

Alternative tests that work in general are

Possibly you could do something clever with rescaling the data or working with conditional distributions, but I don't see direct how.

$\endgroup$
1
  • $\begingroup$ Possibly you could use transformations like $y_i = x_i^p$ or $x_i = y^{1/p}$ and add a scaling based on $\sum y_i$ which will give a uniform distribution for the $y_i$ (only the boundaries of the distribution will not be so clear). $\endgroup$ Commented Mar 17, 2023 at 15:52
0
$\begingroup$

If the most important aspect is "visual" (rather than "verify"), then thinking about what kinds of deviations might exist (and what might cause the deviations) and how one might display the data that would show those deviations is required.

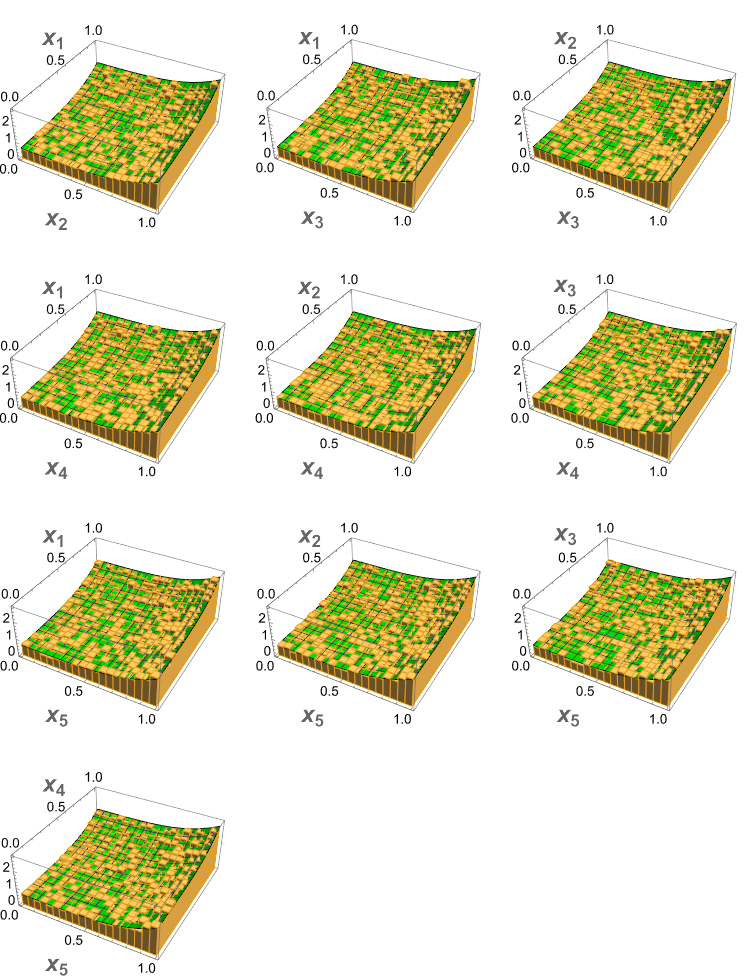
Unless you're on acid, 3D plots might be the extent as to what you can display (other than changes in 3D plots over time if there was a time element). Below I increased your sample size to n <- 1e5 and created 3D histograms (with estimated probability density as the vertical axis) along with the bivariate pdf for each pair of variables (using Mathematica).

data = Import["pairs.csv"];
data = data[[2 ;;]];
data = data[[All, 2 ;;]];
labels = {"\!\(\*SubscriptBox[\(x\), \(1\)]\)", 
   "\!\(\*SubscriptBox[\(x\), \(2\)]\)", 
   "\!\(\*SubscriptBox[\(x\), \(3\)]\)", 
   "\!\(\*SubscriptBox[\(x\), \(4\)]\)", 
   "\!\(\*SubscriptBox[\(x\), \(5\)]\)"};
p = 5;
figures = Table[Show[Histogram3D[data[[All, {1, 2}]], Automatic, "PDF",
    RotationAction -> "Clip", SphericalRegion -> True,
    AxesLabel -> (Style[#, Bold, 18] &) /@ {labels[[i1]], labels[[i2]], ""}],
   Plot3D[(p - 2)/p + x[1]^(p - 1) + x[2]^(p - 1), {x[1], 0, 1}, {x[2], 0, 1},
    PlotStyle -> Green]],
  {i1, 2, 5}, {i2, 1, i1 - 1}]

10 pairwise 3D histograms with bivariate marginal density survace.

The over- and under-estimates of density seem to occur without any pattern and none appear to be large.

$\endgroup$
2
  • $\begingroup$ What if the dimension goes higher? We have to plot ${p \choose 2}$ graphs? $\endgroup$
    – Chia
    Commented Mar 22, 2023 at 6:47
  • $\begingroup$ Of course there's a limit. Your question mentioned $p=5$ which is doable. So far I see no responses addressing your "visual" aspect. But maybe that's because you haven't stated what kinds of departures might occur or the consequences of any types of departures. $\endgroup$
    – JimB
    Commented Mar 22, 2023 at 14:27

Your Answer

By clicking “Post Your Answer”, you agree to our terms of service and acknowledge you have read our privacy policy.

Not the answer you're looking for? Browse other questions tagged or ask your own question.