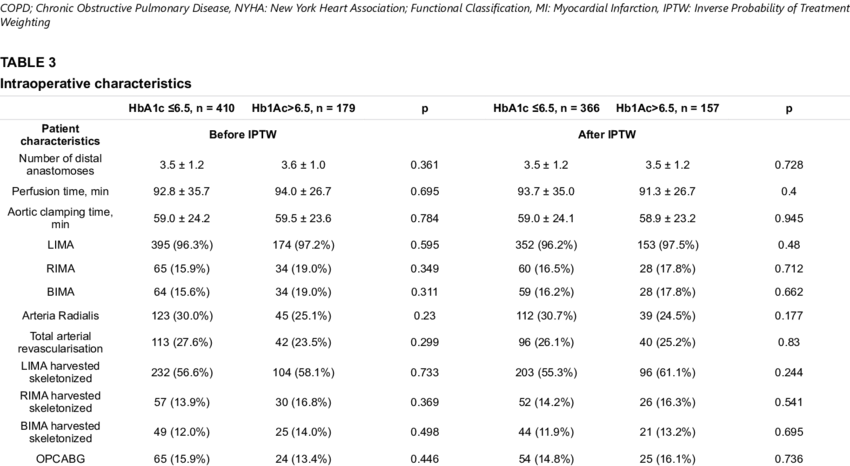
I am doing propensity score weighting with the package "Weightit" and I want to have a Table 1 "Before and After Weighting" like this one:
As you can see, data are displayed EITHER as MEAN±SD or frequency(percentage) depending whether the variable is continous or categorical. I want to do the same thing. This is my code:
data("lalonde", package = "cobalt")
library(cobalt)
library(WeightIt)

W.out <- weightit(treat ~ age + educ + race + married + nodegree + re74 + re75,
                  data = lalonde, estimand = "ATT", method = "ps")
W.out

bal.tab(W.out, stats = c("m", "v"), thresholds = c(m = .05), disp=c("means", "sds"))
However, by using bal.tab from cobalt package the problem is that it only shows means (SD) and DOESN'T SHOW frequency(percentage) for categorical variables as I want to. How can I overcome this problem? I can also use another package both for IPTW and for creating tables. I just want to perform IPTW and create a table before and after.

