I'd like to model the optimal quantile regression curves of probabilities as function of xa, using qgam ideally (mgcv-based R package), but not necessarily:
Data:
dat <-
structure(list(prob = c(0.043824528975438, 0.0743831343145038,
0.0444802301649798, 0.0184204002808217, 0.012747152819121, 0.109320069103749,
0.868637913750677, 0.389605665620339, 0.846536935687218, 0.104932383728924,
0.000796924809569913, 0.844673988202945, 0.00120791067227541,
0.91751061807481, 0.0140582427585067, 0.61360854266884, 0.55603090737844,
0.0121424615930165, 0.000392412410090414, 0.00731972612592678,
0.450730636411052, 0.0111896050578429, 0.0552971757296455, 0.949825608148576,
0.00216318997302124, 0.620876890784462, 0.00434032271743834,
0.809464444601336, 0.890796570916792, 0.0070834616944228, 0.0563350845256127,
0.913156468748195, 0.00605085671490011, 0.00585882020388307,
0.0139577135093548, 0.0151356267602558, 0.00357231467872644,
0.000268107682417655, 0.047883018897558, 0.137688264298974, 0.846219411361109,
0.455395192661041, 0.440089914302649, 0.312776912863294, 0.721283899836456,
0.945808616162847, 0.160122538485323, 0.274966581834218, 0.223500907500226,
0.957169102670141, 3.29173412975754e-05, 0.920710197397359, 0.752055893010363,
0.204573327883464, 0.824869881489217, 0.0336636091577387, 0.834235793851965,
0.00377210373002217, 0.611370672834389, 0.876156793482752, 0.04563653558985,
0.742493995255321, 0.42035122692417, 0.916359628728296, 0.182755925347698,
0.139504394672643, 0.415836463269909, 0.0143112277191436, 0.00611022961831899,
0.794529254262237, 0.000295836911230635, 0.88504245090271, 0.0320097205131667,
0.386424550101868, 0.724747784339428, 0.0374198694261709, 0.772894216412908,
0.243626917726206, 0.884082536765856, 0.649357153222083, 0.651665475576256,
0.248153637183556, 0.621116026311962, 0.254679380328883, 0.815492354289526,
0.00384382735772974, 0.00098493832845314, 0.0289740210412282,
0.919537164719931, 0.029914235716672, 0.791051705450356, 0.535062926433525,
0.930153425256182, 0.739648381556949, 0.962078822556967, 0.717404075711021,
0.00426200695619151, 0.0688025266083751, 0.30592683399928, 0.76857384388609,
0.817428136470741, 0.0101583095649087, 0.190150584186769, 0.949353043876038,
0.000942385744019884, 0.00752842476126574, 0.451811230189468,
0.878142444707428, 0.085390660867941, 0.705492062082986, 0.00776625091631656,
0.120499683875168, 0.871558791341612, 0.204175216963286, 0.88865934672351,
0.735067195665991, 0.111767657566763, 0.0718305257427526, 0.001998068594943,
0.726375812318976, 0.628064249939129, 0.0163105011142307, 0.585565544471761,
0.225632568540361, 0.914834452659588, 0.755043268549628, 0.44993311080756,
0.876058522964169, 0.876909380258345, 0.935545943209396, 0.856566304797687,
0.891579321327903, 0.67586664661773, 0.305274362445618, 0.0416387565225755,
0.244843991055886, 0.651782914419153, 0.615583040148267, 0.0164959661557421,
0.545479687527543, 0.0254178939123714, 0.00480000384583597, 0.0256296636591875,
0.776444262284288, 0.00686736233661002, 0.738267311816833, 0.00284628668554737,
0.0240371572079387, 0.00549270830047392, 0.91880163437759, 0.336534358175717,
0.276841848679916, 0.718008645244615, 0.0897424253787563, 0.0719730540202573,
0.00215797941000608, 0.0219160132143199, 0.797680147185277, 0.66612383359622,
0.946965411044528, 0.133399527090937, 0.343056247984854, 0.202570454449074,
0.00349712323805031, 0.919979740593237, 0.577123238372546, 0.759418264563034,
0.904569159000302, 0.0179587619909363, 0.785657258439329, 0.235867625712547,
0.959688292861383, 0.668060191654474, 0.0014774986557077, 0.00831528722028647,
0.669655207261098, 0.157824457113222, 0.110637023939517, 0.262525772704882,
0.112654002253028, 0.22606090266161, 0.157513622503487, 0.25688454756606,
0.00201570863346944, 0.70318409224183, 0.25568985167711, 0.810637054896326,
0.92708070974999, 0.608664352336801, 0.707490903842404, 0.00094520948858089,
0.106177223644193, 0.582785205597368, 0.0585327568963445, 0.377814739935042,
0.972447647118833, 0.0111118791692372, 0.58947840090326, 0.0111189166236961,
0.00317374095338712, 0.0664218007312096, 0.00227258301798719,
0.00198861129291917, 0.337443337988163, 0.750708293355867, 0.837530172974158,
0.627428065068903, 0.744110974625108, 0.00320417425932798, 0.871800026765784,
0.613647987816266, 0.808457030433619, 0.00486495461698562, 0.597950577021363,
0.000885253981642748, 0.0800527366346806, 0.00951706823839207,
0.125222576598629, 0.346018567766834, 0.0376933970313487, 0.157903106929268,
0.0371982251307384, 0.00407175432189843, 0.0946588147179984,
0.967274516618573, 0.169109953293894, 0.00124072042059317, 0.00259042255361196,
0.000400511359506596, 0.841289470209085, 0.807106898740506, 0.926962245924993,
0.814160745645036, 0.662558468801531, 0.000288068688170646, 0.698932091902567,
0.00242011818508616, 0.645573844423654, 0.517121859568318, 0.0931231998319089,
0.000877774529895907), xa = c(6.85, 7.65, 7.6, 6.65, 7.35, 8.6,
9.8, 8.25, 9.65, 7.6, 5.95, 11.75, 6.05, 10.75, 7, 8.25, 7.25,
7.55, 6.4, 7.45, 7.15, 7.1, 7.4, 8.85, 6.65, 7.75, 6.95, 7.25,
9.35, 6, 7.5, 9, 7.1, 7.75, 7.55, 6.95, 6.85, 5.8, 7.4, 7.45,
9.7, 8.1, 7.6, 8.1, 8.45, 9.45, 8, 7.25, 7.05, 9.5, 5.05, 10.15,
8.7, 7.7, 8.4, 7.5, 9.25, 6.85, 7.45, 11.85, 7.9, 7.6, 8.3, 10.35,
7.95, 7.9, 8.65, 7.05, 6.9, 9.6, 5.5, 12.2, 7.45, 7.5, 7.2, 7.05,
8.7, 7.25, 8.35, 8.45, 8.05, 8.05, 8.25, 7.7, 9, 6.95, 6.75,
6.55, 8.9, 7.4, 9.35, 8.45, 10.35, 8.65, 9.6, 8.75, 7.05, 7.8,
7.95, 8.4, 8.3, 7.6, 8.3, 8.7, 6.65, 7.1, 7.7, 10.1, 7.75, 9.05,
6.5, 6.3, 9.45, 7.7, 7.65, 8.15, 7.35, 7.6, 7.2, 8.35, 7.65,
6.8, 11.45, 7.35, 12.65, 9.15, 8.15, 10.6, 8.6, 11, 9.85, 9.2,
9, 7.8, 7.25, 7.65, 8.35, 8.4, 7.55, 7.55, 7.55, 6.95, 8.15,
8.65, 6.95, 8.5, 4.75, 7.3, 7.65, 9.15, 7.45, 8.2, 7.8, 7.3,
7.35, 6.1, 7.35, 7.25, 8.15, 9.55, 7.15, 7.15, 7.2, 7.2, 8.25,
8.7, 8.85, 10.35, 7.5, 7.45, 7.05, 15.15, 8.7, 6.15, 6.55, 16.05,
7.6, 6.55, 7.45, 7.6, 8.15, 6.05, 6.55, 6.65, 7.35, 7.3, 9.4,
10.05, 10.85, 8.5, 6.4, 7.15, 7.5, 6.25, 7, 9.55, 6.85, 8.2,
6.7, 7.2, 7.25, 7.05, 7.25, 6.9, 9.1, 9.4, 7.45, 7.8, 5.55, 7.8,
8.7, 7.65, 6.9, 8.25, 6.4, 7.5, 7.55, 7.95, 7.35, 7, 7.3, 6.65,
6.65, 6.9, 8.65, 8.25, 5.95, 6.55, 6.1, 7.7, 10.95, 11.15, 8.85,
7.35, 6, 7.75, 5.45, 7.55, 7.1, 7.35, 6.45)), row.names = c(NA,
-241L), class = "data.frame")
Code:
library(qgam)
library(mgcViz)
library(ggplot2)

# qgam
qg.5 <- qgamV(prob ~ s(xa, bs="tp", k=20), data = dat, qu = 0.5)
qg.25 <- qgamV(prob ~ s(xa, bs="tp", k=20), data = dat, qu = 0.25)
qg.75 <- qgamV(prob ~ s(xa, bs="tp", k=20), data = dat, qu = 0.75)

# add fitted values to dat
dat$fit_prob.5 <- qg.5[["fitted.values"]]
dat$fit_prob.25 <- qg.25[["fitted.values"]]
dat$fit_prob.75 <- qg.75[["fitted.values"]]

# predict xa at prob = 0.5
xa_at_prob.5 <- with(dat, approx(fit_prob.5, xa, xout=0.5)); xa_at_prob.5

# plot
ggplot(dat, aes(x = xa, y = prob)) +
  geom_point() +
  geom_line(aes(y = fit_prob.5), lwd = 1.2) +
  geom_line(aes(y = fit_prob.25), lwd = 1.2, linetype = "longdash") +
  geom_line(aes(y = fit_prob.75), lwd = 1.2, linetype = "longdash") +
  geom_vline(xintercept = xa_at_prob.5[["y"]], linetype = "longdash", color = "black", linewidth = 0.6) +
  scale_y_continuous(breaks = seq(0, 1, 0.1)) +
  scale_x_continuous(breaks = seq(0, 16, 1)) +
  geom_hline(yintercept=c(0, 0.5, 1), linetype="solid", color = "black", linewidth = 0.3) +
  theme_classic(base_size = 20) +
  coord_cartesian(xlim = c(4, 13))
However, looking at the graph below, I've two concerns:
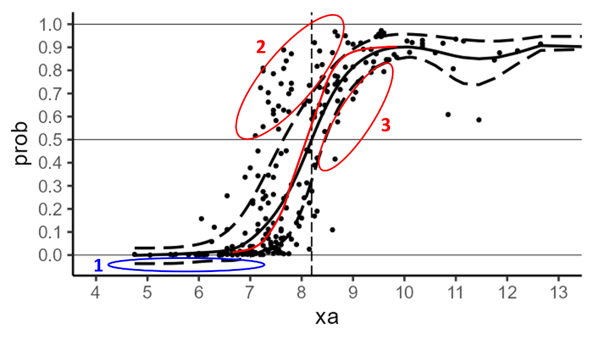
Question 1: Some fit_prob.25 values are negative, as shown on the 0.25 quantile curve (blue area 1). I think this is because qgam does not consider prob values as probabilities, i.e., values that must be constrained between 0 and 1. Is it the problem? How to solve it?
Question 2: Surprisingly, the curves don't seem to fit the data very well; there are more points in red zone 2 (about n=30) than in zone 3 (about n=10). Slightly more left and steeper quantile curves would seem to fit better (like the approximative red median curve part). Is there an explanation for this inappropriate fitting?
Any help, advice or reference would be greatly appreciated


xa=7andxa=8, there are a lot with very low probabilities and a lot with probabilities > 0.5.xais not doing a good job of distinguishing between them, unlike for lower and higher values. This, I suspect, is the root of the quantile regression problem. $\endgroup$