4
$\begingroup$

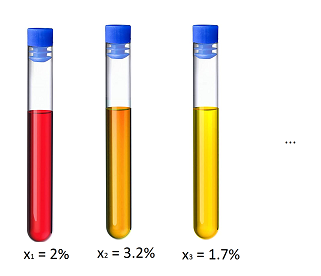
Let's say we have 10 calibrated reference samples of chemical products with a known concentration $x_i$ of a certain chemical component A.
$x_i$ is different for each sample.

enter image description here

We are building a chemical test workflow to detect the concentration of A in any chemical product, and we get a measurement $y_i$ for each of the 10 samples.

Note: if there is no "component A" in the chemical sample ($x_i=0$), then $y_i$ should be as close as zero as well, but it's not really true, due to real-world conditions.

Now here is the question:

We do know that there is a linear relation between the real concentration $x_i$ and our measurement $y_i$. Therefore we do a least-square regression $y = a x + b$, let's say:

$$y = 1.2 x + 100$$

Now if we change some workflow settings in our chemical test (modification in our chemistry protocol), our raw measurements data values change, and we get another regression $y = c x + d$, let's say

$$y = 2.3 x + 150$$

Question: how to evaluate the "quality" of these 2 different detection tests? (except using the $R^2$ parameter which is always close to 0.98 or 0.99)

Intuitively it seems that the highest $$Q = \frac{a}{b},$$ the more our test is sensitive to the presence of the chemical component A. But does this quantity $Q$ have a name in the context of a statistical regression?

Example: if we had $$y=0.001x + 50,$$ empirically, we would have very similar measurement values $y_i$ even if $x_i$ changes a lot from $1$ to $10$. Here, the ratio $Q = \frac{a}{b}$ is very low, indicating a poor sensitivity in the detection of the chemical component A.

Are there other "quality factors" for comparing multiple workflows (each of them giving different $a$ and $b$ in the $y=ax+b$ regression) that show a relationship between a known real-world quantity $x_i$ and a measurement $y_i$?


TL;DR: we have 3 different chemistry protocols for detecting the amount $x_i$ of a component A in chemical products. Our measurements are noted $y_i$. For each protocol we have a different relationship between $x_i$ and $y_i$:

$$\begin{align}y & = 1.2 x + 100\\ y & = 2.3 x + 150\\ y & = 0.001 x + 50\end{align}$$

with similar $R^2$ coefficients. How to find which protocol is the most sensitive?

$\endgroup$
16
  • 1
    $\begingroup$ How do you define "best"? $\endgroup$
    – Tim
    Commented May 11, 2023 at 13:44
  • 3
    $\begingroup$ It will be worth your time to study some of the principles of chemometrics, especially as they pertain to calibration and detection limits. This set of questions has no single or easy answer because it depends on so many things, such as the linearity (or lack thereof) of your measurement system at low levels, the homoscedasticity (or lack thereof) of measurement errors, your QA/QC system, and much more. $\endgroup$
    – whuber
    Commented May 11, 2023 at 14:05
  • 2
    $\begingroup$ There is an enormous literature on this. A good place to start would be modern references to Lloyd Currie, who focused on detection and quantitation limits in his research and publications in the 1980's. Many laboratories are heavily regulated at all governmental levels -- state, national, international -- because their work is critical to medicine, safety, nuclear power, the environment, and much more. Some of the US federal and state guidance, and even the regulations themselves, can be quite informative. $\endgroup$
    – whuber
    Commented May 11, 2023 at 14:32
  • 3
    $\begingroup$ "Detection limit", "quantitation limit", "limit of quantitation", "chemometrics", "laboratory standards", "laboratory QA/QC", etc., etc. For related posts here on CV, search chemometrics calibration. $\endgroup$
    – whuber
    Commented May 11, 2023 at 15:02
  • 2
    $\begingroup$ @AdamO Oh really? I often see y = a x + b, at least in french textbooks, maybe it's dependent on the country? $\endgroup$
    – Basj
    Commented May 11, 2023 at 16:19

1 Answer 1

3
$\begingroup$

$-b/a$ is equivalent to the intercept with the x-axis and may sometimes have specific meaning.

For example in a Lineweaver Burk plot the value is related to the Michaelis-Menten kinetics model as $a/b = K_m$. That is, when we plot $1/v$ versus $1/c$ then the Michaelis-Menten equation

$$v = \frac{Vc}{K_m +c}$$ becomes equivalent to your linear regression equation

$$\underbrace{\vphantom{\frac{Km}{V}}(1/v)}_{y} = \underbrace{\frac{K_m}{V}}_{a} \cdot \underbrace{\vphantom{\frac{Km}{V}}(1/c)}_{x} + \underbrace{\frac{1}{V}}_{b}$$

and the quotient of regression coefficients is $$\frac{a}{b} = \frac{K_m/V}{1/V}= K_m$$


In linear regression it doesn't have any specific name that I am aware of (except for possibly something like 'the negative of the x-axis intercept').


In your specific example it may play some role, but it is not very clear. It depends on how the error of measurements are made by your device.

The error might increase with the magnitude of $y$, but this may not need to be linear. For example reading of some voltage on a digital meter will have a round of error, and that has the same error whether is a large or small value. The same is true for many other instruments which have relatively similar error for smaller and larger values.

It might potentially be better to quantify the error of the observed/estimated concentration as function of the concentration $x$ and express something like the difference in two concentrations that is noticeable at some given power. Certainly a larger intercept $b$, and a smaller slope $a$ will make this relative error worse, but it is better to express it more directly. The quotient of $a/b$ doesn't cover all of the nuances.

$\endgroup$
12
  • $\begingroup$ Actually a/b in that example equals -Km, as the x-intercept in a MM plot is negative. $\endgroup$ Commented May 12, 2023 at 14:32
  • $\begingroup$ @HarveyMotulsky you are right, I missed a minus. $\endgroup$ Commented May 12, 2023 at 14:43
  • 1
    $\begingroup$ @Alexis Thanks for reminding me of quotient. I am not going to stop using the word ratio more generally. For example, standard pitfalls or places to be wary are that ratios are often skewed and/or often unstable (because of sensitivity to denominators) and they can give to bizarre or puzzling artefacts. There is literature on this going back beyond Karl Pearson in which the word ratios recurs for unit-free and unit-bound measures alike. I don't think the term quotient is standard in this context. I am often called pedantic myself, but I think statistical usage is clear-cut here. $\endgroup$
    – Nick Cox
    Commented Nov 10, 2023 at 18:38
  • 1
    $\begingroup$ +1 @NickCox Thank for giving me stuff to chew on! :) I have encountered this idea about statistical conundrums arising from ratios/quotients (i.e. $\frac{\text{ratio}}{\text{quotient}}$ … I kid! I kid! ;) before. Do you have a good recommendation for an overview of relevant issues related to such quantities? $\endgroup$
    – Alexis
    Commented Nov 10, 2023 at 18:46
  • 2
    $\begingroup$ I hadn't noticed it before I started Googling but jstor.org/stable/4219582 seems to be one way into the literature. I'd add as part of folklore that logarithms are often a good idea for ratios so long as those ratios are positive and reciprocals can be as good or better an idea. So the reciprocal of a time is a speed or rate, and vice versa. Miles per gallon and gallons per mile are competitors too; indeed cars in USA and Britain are reported through their mpg but in many countries litres per km is standard. $\endgroup$
    – Nick Cox
    Commented Nov 10, 2023 at 19:12

Your Answer

By clicking “Post Your Answer”, you agree to our terms of service and acknowledge you have read our privacy policy.

Not the answer you're looking for? Browse other questions tagged or ask your own question.