0
$\begingroup$

My master's thesis involves modelling fMRI data. Each of $M$ participants has a total of $N$ voxels being measured. All these measurements represent an activation amplitude. Aside from this, I have data on participant characteristics (e.g. age, gender, etc.). My aim is to get posterior distributions across the assignment probabilities of the classes. In essence I want to cluster them using a mixture model. And I want to know how likely each cluster is per voxel. Either the voxel is negatively, positively, or 'null' activated, so there are three classes.

What I am trying to do is fit a three-component Gaussian mixture model. Let's denote this as follows using the allocation variable perspective, so I condition on some grouping $z_i$. For simplicity's sake I will just take the variance to be equal across components:

$$ y_i | z_i \sim \mathcal{N}(\mu_{z_i}, \sigma^2)\quad \text{with}\quad \pi(z_i = g) = \frac{1}{3} $$

As I understand each $\mu_{z_i}$ can again be modelled using a linear combintation of mixed effects. This is where I get stuck. As I undersand random-effects, they allow to account for group-level variation. For instance, each of my $M$ participants can be assigned its own random-intercept, allowing for prediction to be more accurate. However, this appears to be at odds with the formulation of the mixture model: there are only three components. How can I then get $M$ different values given the restriction of three components? What am I overlooking? My understanding of the mixture model is probably wrong.

$\endgroup$
7
  • $\begingroup$ The random intercept is not very well explained. Modelling random effects make sense when you have repeated measurements within a group for which the effect remains the same, otherwise it is effectively just a random error term. In your question you do not explain what sort of experimental design you have and which groupings you have. Without explaining your data or experiment you start with "I want to create a Bayesian mixture model with three components", but possibly it might be better to start with your actual problem and explain what you want to model instead of what model you want. $\endgroup$ Commented May 26, 2023 at 14:28
  • $\begingroup$ Thank you for the feedback. I will create more context $\endgroup$
    – BasMts
    Commented May 26, 2023 at 14:28
  • $\begingroup$ That being said, I am primarily interested in examining the Gaussian mixture model. The data it is being applied to is somewhat secondary. The random effects are more important, as I also want to look into spatial random effects. And then explore if I can fit them using a specific computational technique $\endgroup$
    – BasMts
    Commented May 26, 2023 at 14:41
  • $\begingroup$ It might help if you explain the subscript $i$, is it the participant id or the id of the MxN measurements? $\endgroup$ Commented May 26, 2023 at 15:00
  • $\begingroup$ What are the values of $\mu_1$, $\mu_2$ and $\mu_3$? Are they fixed or are they random with variation between different participants? $\endgroup$ Commented May 26, 2023 at 15:02

1 Answer 1

0
$\begingroup$

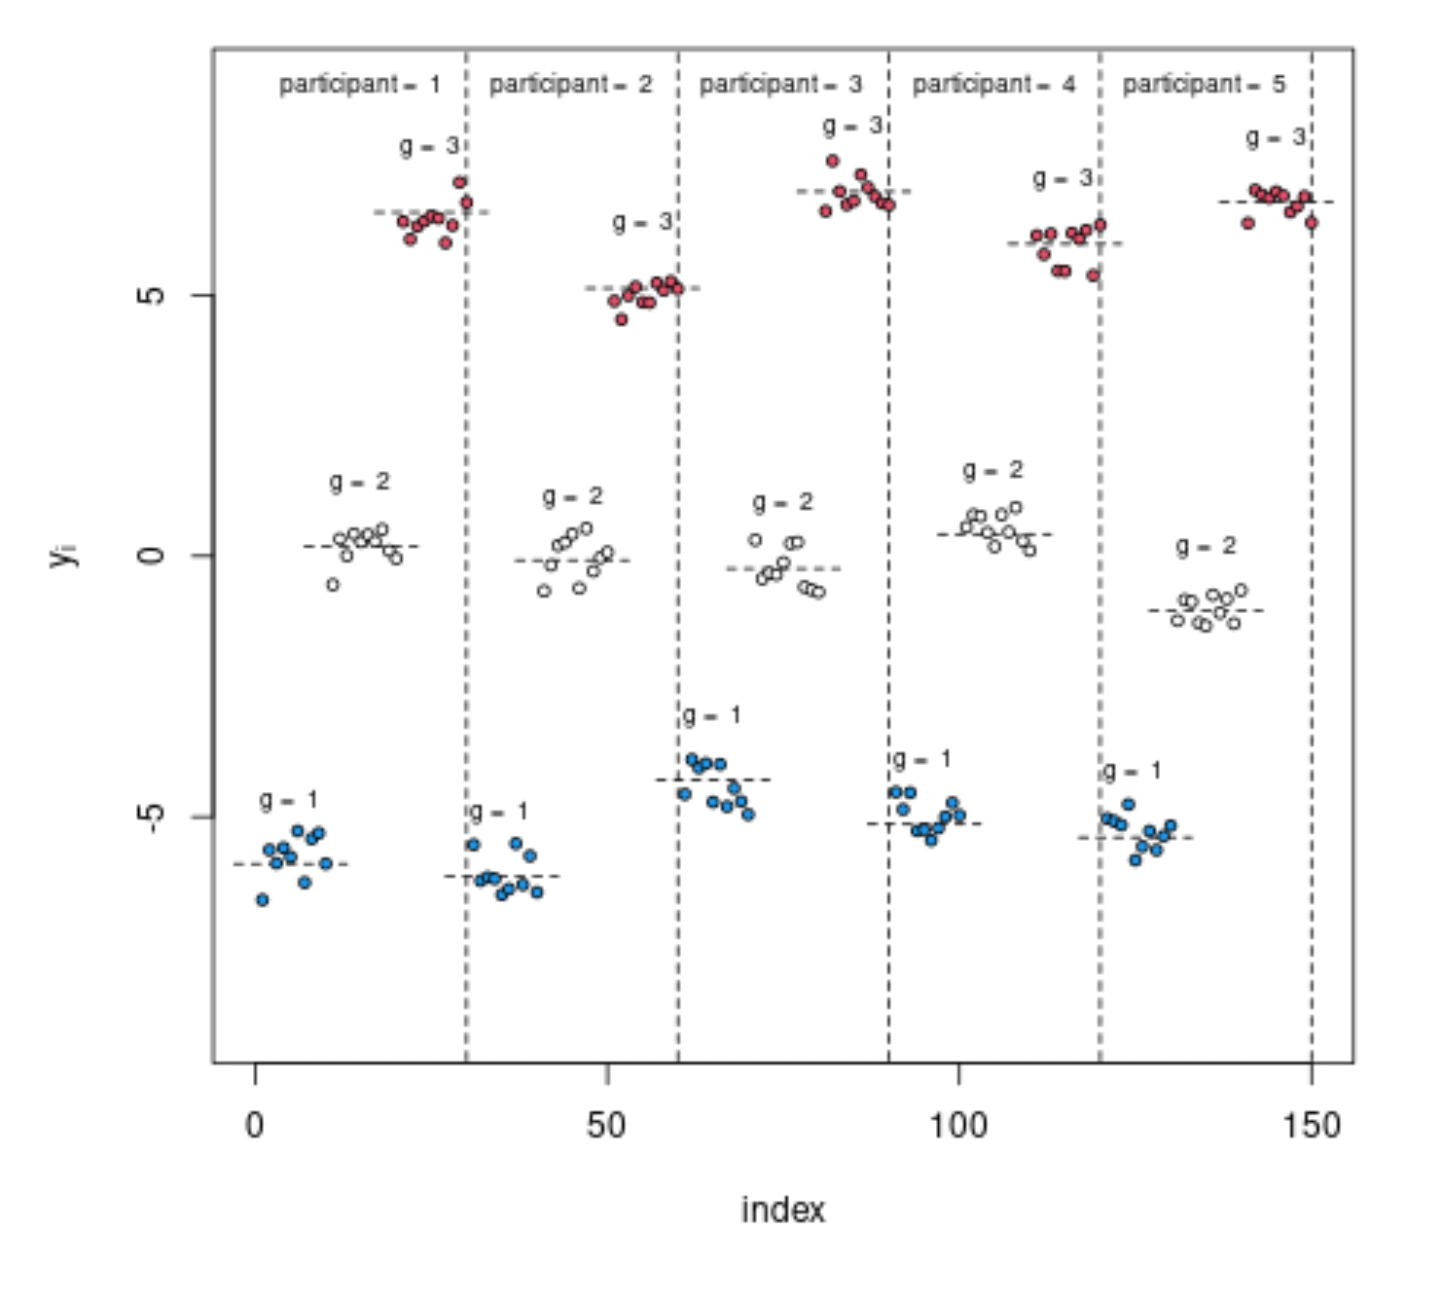
Here is a potential viewpoint of the sort of model that you can have:

$$y_i|z_i,x_i \sim \mathcal{N}(\mu_{z_i,x_i},\sigma_\epsilon)$$

where $x_i$ is an index for the individual. With priors

$$\begin{array}{}z_i &\sim& \pi(z_i = g) = 1/3 \\ \mu_{z_i,x_i}|z_i &\sim& \mathcal{N}(\mu_{z_i},\sigma) \end{array}$$


Below is a visualisation of a potential distribution with 5 individuals and 10 measurements per level per individual, when $\mu_i = (-5,0,5)$, $\sigma = 1$ and $\sigma_\epsilon = 0.3$.

example

$\endgroup$

Your Answer

By clicking “Post Your Answer”, you agree to our terms of service and acknowledge you have read our privacy policy.

Not the answer you're looking for? Browse other questions tagged or ask your own question.