1
$\begingroup$

I have a set of patients (n=27) that all died from a tumor. They all underwent surgery by the same surgeon. And all of them had their tumors removed by different percentages. They all received the same chemotherapy regimen.

Patients Tumor percentage Survival Days
A 2 350
B 10 120
C 50 60

I'm trying to figure out if survival is affected by our removal extent. I can use arbitrary cutoff points (90% and 98% were statistically significant while 95, wasn't). 90 and 98 were shown by older studies as valid cutoff points.

There is also a marker for tumor proliferation, Ki67, that might also affect survival independently. How can I factor it as well, or check for its effect?

Which test would you suggest for analysis?


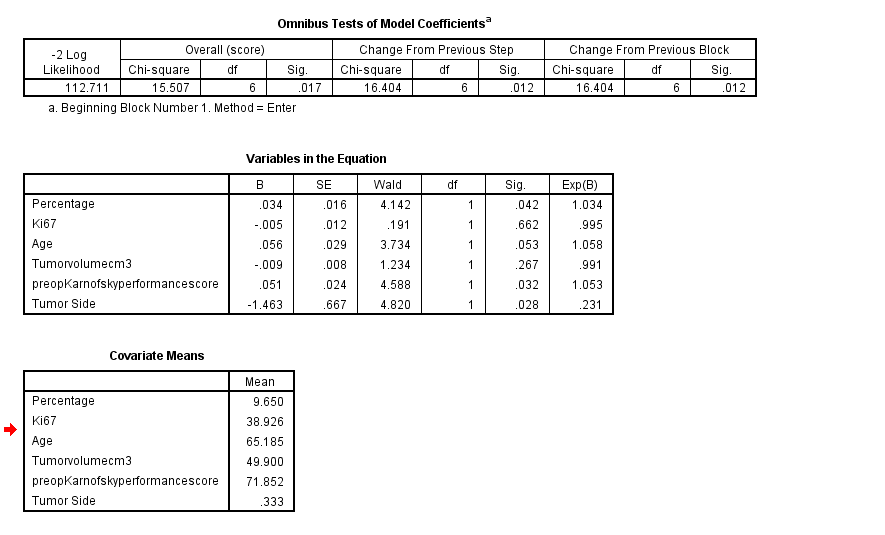
As suggested, I did a Cox Regression test with all the covariates. Ki67 being the tumor proliferation rate, tumor size being preoperative volume of the tumor, tumor size is categorical (left/right), Karnofsky score shows how well the patient is (100 being healthy, 0 being dead).

Yet I'm not sure how to interpret these results now...

Cox Regression Test Results

$\endgroup$
5
  • 1
    $\begingroup$ I’m assuming you have censoring that is not all 27 patients have , I would start with Cox PH which is a semi parametric survival analysis. Low sample size could be an issue, if you have strong belief about a parametric distribution example Weibull, then I would use a parametric survival analysis. $\endgroup$
    – forecaster
    Commented Jun 4, 2023 at 16:28
  • $\begingroup$ I agree with @forecasters suggestions :-) You can do Cox ph regression no matter if your data are censored or not. $\endgroup$
    – Ute
    Commented Jun 4, 2023 at 16:34
  • $\begingroup$ @forecaster Hm. Maybe I don't quite understand Cox regression test but all the patients in my dataset have all reached their end point (ie. dead). I want to figure out whether how much tumor we resected affects how fast they reached this end point. $\endgroup$ Commented Jun 4, 2023 at 17:39
  • $\begingroup$ The 3 "Omnibus Tests" evaluate the model as a whole; all indicate a statistically significant association between the predictors as a whole and outcome. The model that you built is almost certainly overfit, however. You have estimated 6 regression coefficients (used up 6 "degrees of freedom," df, one for each of the "Variables in the Equation"), but only have 27 events (deaths, here) to work with. You typically need about 15 events per df to avoid overfitting; you have less than 5. Also, you modeled a strict linear association between log-hazard and each continuous variable. $\endgroup$
    – EdM
    Commented Jun 5, 2023 at 13:25
  • $\begingroup$ As you seem to be using SPSS, the documentation should explain the details of the output tables. For the coefficients, the "B" values are the regression coefficients in the log-hazard scale and the "Exp(B)" values are the corresponding hazard ratios. $\endgroup$
    – EdM
    Commented Jun 5, 2023 at 13:36

2 Answers 2

0
$\begingroup$

Even though all patients have died, it's still a good idea to use a Cox regression model for this type of data. That way, you model whether the risk of death over time is associated with the predictor (Tumor Percentage). You don't have to make any assumptions about the distributions of actual times (Survival Days), like you would for a standard regression model. Only the order of the deaths in time matters.

Furthermore, a Cox model can allow you to include patients who received the therapy but haven't yet died. In fact, if there are such patients, it would be incorrect to omit information about them. Otherwise your results will be biased.

Using cutoffs of continuous predictor values like Tumor Percentage is not a good idea. Keep them continuous. In a Cox model, you then examine the association between the log of the hazard of death and the value of the predictor.

It's unlikely that there is a strict linear association between Tumor Percentage and the log-hazard of death, however. A regression spline can let the data tell you the form of the association while you test its significance. You can specify the flexibility of the association by specifying the number of "knots" in the Tumor Percentage that separate the regions that are fit internally with smooth curves. An alternative is what's called a "penalized spline," available with a pspline() term in the R coxph() function. This page explains the difference, with links for further study.

In principle, you could do a multiple regression involving both Tumor Percentage and Ki67 as predictors in the Cox model. The danger in this situation is that you only have 27 cases, while you typically need about 15 times as many cases with events as the number of "degrees of freedom" you are using up in the model (the effective number of coefficients that you are fitting). I understand that Ki67 is a continuous measure, and thus should be modeled flexibly like I recommend for Tumor Percentage. The problem is that the extra flexibility provided by splines for continuous predictors involves using up more degrees of freedom, so a simple flexible fit to Tumor Percentage by itself might be as far as you can push the data that you have.

$\endgroup$
0
$\begingroup$

I was able to find a slot with our biostatistician.

She suggested since all the patients have reached the end point, rather than a Cox regression, a linear regression would be enough. To obtain a normal distribution, she also took the log values of the percentages.

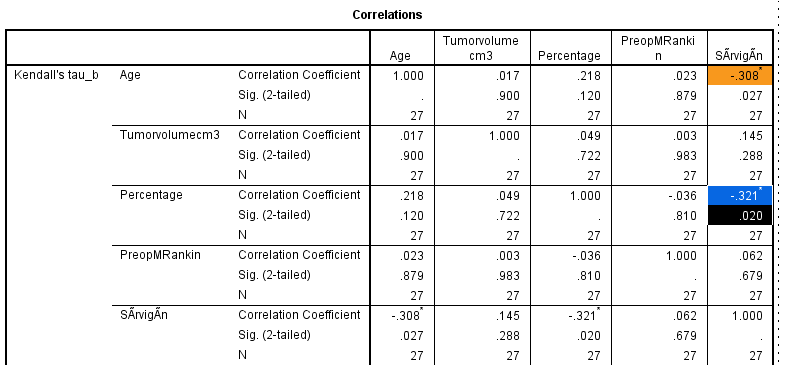
Nonparametric Correlations

Linear Regression

Which revealed while the age and percentage seem to have an effect individually, if factored together, only age actually has an effect on survival.

Thanks for all the help.

$\endgroup$

Your Answer

By clicking “Post Your Answer”, you agree to our terms of service and acknowledge you have read our privacy policy.

Not the answer you're looking for? Browse other questions tagged or ask your own question.