I have a dataset of 10 columns and approx 4,5k rows, each row representing a sampling point. As sampling points share some common features, a categorical variable with 27 levels were created to address some random effects. The columns contain information related to the sex ratio at birth (SRB; number of sons/number of daughters; thus, >1 = male-biased offspring sex ratio, <1 = female-biased ratio, and 1 = equilibrium). Among the columns, one of them contains a general SRB value, while others have SRB values according to the mother's school level and age. I also have one column containing adult sex ratio (ASR).
That said, I'm trying to model the general SRB values as a function of the SRB grouped by mothers' age, school level and by ASR. As I'm working with ratio values, I choose not to log transform my data, even though some ratios are very large, say, 10 to 1, while others are very small, 1 to 10. To work around this issue, however, I started by excluding outliers from my dataset through the IQR method based on the ASR column:
#Data discretization
data$ASR_category <- ifelse(data$ASR > 1.46, "male_biased", ifelse(data$ASR < 0.96, "female_biased", "fisherian_equilibrium"))

library(dplyr)

# Calculate the Interquartile Range (IQR) for ASR
iqr_results <- data %>%
  group_by(ASR_category) %>%
  summarize(out = list(boxplot.stats(ASR)$out))

out_ind <- which(data$ASR %in% unlist(iqr_results$out))

# Exclude outliers from the dataset
outliers_cleaned <- subset(data, !row.names(data) %in% out_ind)
After excluding outliers from the ASR column, in general, all the remaining columns assumed a normal distribution. However, as SRB is positively skewed and consists of ratio values, I modeled them using family = Gamma(link = "log") through glmmTMB pck.
The model I built is as follows:
gc();glmmTMB_model <- glmmTMB(
  SRB ~ ASR + SRB_15to19 + SRB_20to29 +
    SRB_30to39 + SRB_40to49 + SRB_no_schooling_1to3 +
    SRB_4to7 + SRB_8to11 + SRB_12more + (1|state),
    data = data,
    family = Gamma(link = "log"),
    control=glmmTMBControl(optimizer = optim,
                           optArgs = list(method = "BFGS"))
  )
Here, however, I noticed an issue in the model summary. I have model parameters estimating the effect of my independent variables, though I don't know their effect on each of the discrete states of my dependents (roughly speaking, <1, >1, 1).
Questions:
- Is it recommended to (log) transform ratio values?
- Since all estimates were positive, except for ASR, does it mean that all my independent variables (SRB by educational level and age) bias offspring towards sons? (Note: I don't think this is the correct interpretation of the model parameters I have, as there is a "threshold" in y~, though I don't know the correct interpretation in this case.)
- Could a multinominal regression solve the question above?
- Is
Gamma()the appropriate family to model ratio values? (Note: Although my data assumed a normal distribution after I exclude outliers through IQR, the model withgaussian()family had convergence problems which I wasn't able to workaround even after consulting glmmTMB troubleshooting).
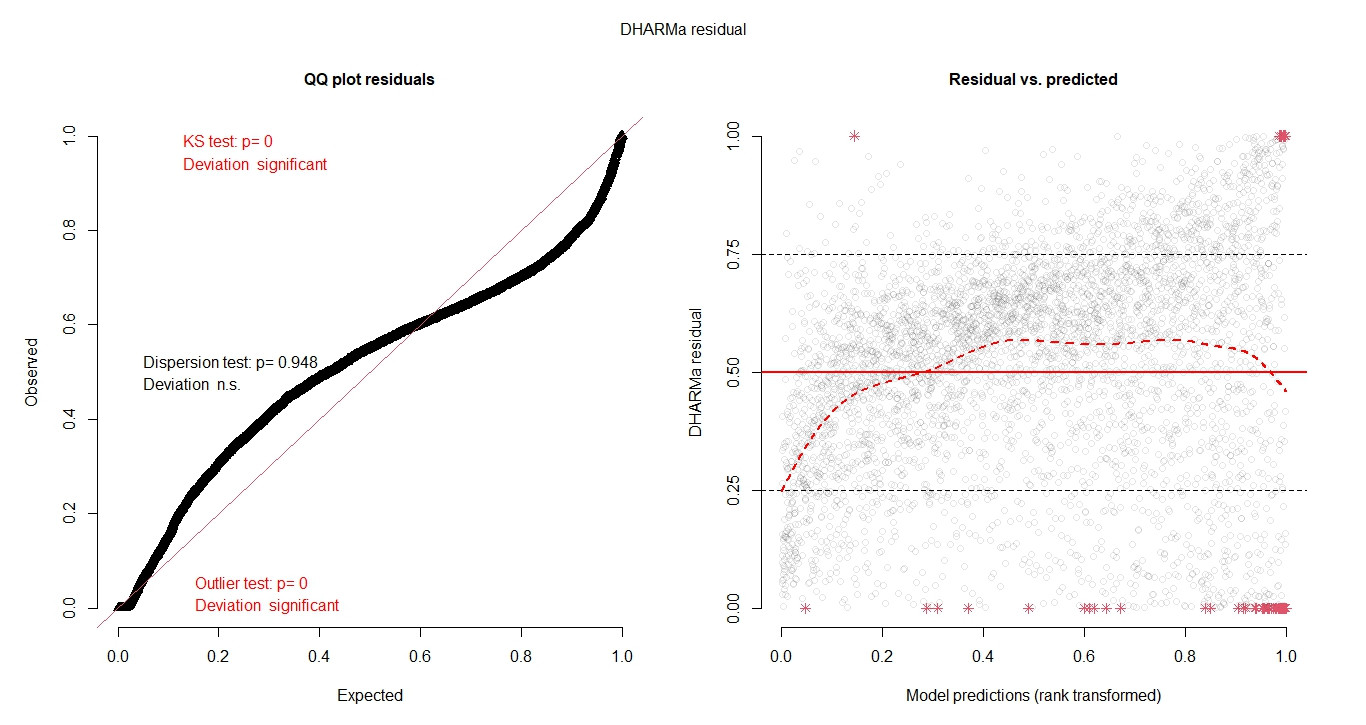
The above model is running smoothly, though you may find some issues when diagnosing it (see code below).
library(DHARMa) x11();plot(simulateResiduals(glmmTMB_model, n = 1000, seed = 123))
glmer() from lme4 also had some warnings(), the model output was:
Model is nearly unidentifiable: very large eigenvalue
And lmer() also didn't fit well:
x11();plot(simulateResiduals(lmer_model, n = 1000, seed = 123))

Here is my session info:
sessionInfo() R version 4.2.3 (2023-03-15 ucrt) Platform: x86_64-w64-mingw32/x64 (64-bit) Running under: Windows 10 x64 (build 22621)
other attached packages: lme4_1.1-33 Matrix_1.5-4.1 DHARMa_0.4.6 glmmTMB_1.1.7
