1
$\begingroup$

Consider the following (in R):

library(MASS)
plot(stack.loss~Air.Flow,data=stackloss)
regression <- rlm(stack.loss~Air.Flow,data=stackloss)
abline(regression)

For each of the points I would like to to test against the null hypothesis that it really is located on the line (rather than where it really is) - in essence quantifying the degree to which these are outliers with respect to the regression model.

Possibly using hopeless search term combinations, I have been unable to identify appropriate methodology. Would it be valid to use for each residual a one-sample t-test (ar equivalent) against the residual population to establish such a measure?

Edit: Further reading seems to indicate that "Tolerance Interval" is what I might be looking for - the "tolerance" R package provides calculations of that. I am however puzzled by the apparent contradictory nature of such intervals for regressions as defined by different publications. In the R package case the tolerance bands seem to track the regression line parallely (see Fig. 12 and below example), while alternative sources such as this operate with bands that are reminiscent of confidence intervals in shape (see Fig. 4). The latter seems more intuitive, but other's opinions would be appreciated.

For each point in a sample I am actually looking for "which x/95% tolerance band is running through this point" ...

Here's how usage of "tolerance" might look like (adding to above code) for 95%/95% 2-sided nonparametric regression tolerance bounds:

library(tolerance)
tol.bounds <- npregtol.int(x=stackloss$Air.Flow,        
    y=stackloss$stack.loss, y.hat=regression$fit, side=2, alpha=0.05, P=0.95, 
    method="WILKS")
lines(tol.bounds$x,y=tol.bounds$"2-sided.lower",col="red")
lines(tol.bounds$x,y=tol.bounds$"2-sided.upper",col="red")
$\endgroup$
4
  • 1
    $\begingroup$ Why do you want to do this? $\endgroup$
    – Thomas
    Commented Jun 17, 2013 at 12:06
  • $\begingroup$ I also don't understand why you want to do this. Possibly you could construct a prediction band and check if your points are inside it? If you just want to quantify the "outlierishness" you could simply check the Huber weights: regression$w. $\endgroup$
    – Roland
    Commented Jun 17, 2013 at 12:13
  • $\begingroup$ Look up studentized residuals. $\endgroup$
    – Andy W
    Commented Jun 17, 2013 at 12:15
  • $\begingroup$ The context is experimental data in which the overwhelming majority of points are expected to correlate linearily, yet the "interesting" points are those that don't. I am thus looking for methodology to in the context of the total population quantify outlierishness in an intuitive manner. $\endgroup$
    – balin
    Commented Jun 17, 2013 at 12:16

2 Answers 2

3
$\begingroup$

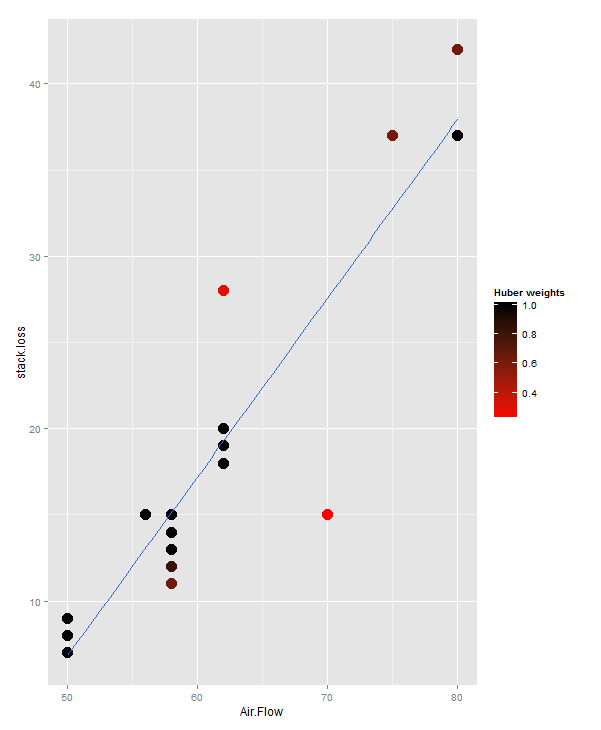
From your comment I think it would be most usefull to look at the IWLS weights:

library(ggplot2)
p <- ggplot(stackloss,aes(x=Air.Flow,y=stack.loss)) + 
  geom_point(aes(colour=regression$w),size=5) + 
  geom_smooth(method="rlm",se=FALSE) +
  scale_colour_gradient(low="red",high="black",name="Huber weights")
print(p)

enter image description here

$\endgroup$
2
  • $\begingroup$ That surely looks like what I am hunting for. Are those interpretable as p-values? Meaning: a point associated with 0.5 has that probability to be identical with the minimized residual m estimator? Would those be subject to multiple hypothesis testing correction? $\endgroup$
    – balin
    Commented Jun 17, 2013 at 12:44
  • 1
    $\begingroup$ No, those cannot be interpreted as p-values. Do you need p-values? From your given goal (identify interesting points) I didn't think so. You might want to read up on robust regression in order to understand these weights. $\endgroup$
    – Roland
    Commented Jun 17, 2013 at 12:51
2
$\begingroup$

The most straightforward way to "quantify outlierishness" would be through the examination of the residuals themselves. (Eg. a qq-plot) But OK, let's see what you want. So a p-value is "the probability, given a null hypothesis for the probability distribution of the data, that the outcome would be as extreme as, or more extreme than, the observed outcome" (MacKay Chapt. 37).

So what is your null hypothesis usually? For starters one would assume a expected value of 0 which would mean that there is no bias in the estimator and that secondly the standard deviation of the residuals is $\sigma$, $\sigma$ being your residual standard error (1.915 in your case). So what we want is really the chance of observing a residual as large as the one we observed given the probability distribution we assumed for the data (where the data are now the residuals themselves). Thus assuming $\epsilon \sim N(0,\sigma^2)$ we can do something like : as.numeric(round( digits= 5,1- pnorm( mean=0, sd=1.915, q= abs(regression_residuals)))) and get a p-value (or z-value in this case to be a bit more exact). But here is the "catch", this is all rubbish. It is rubbish because we have used "robust regression" which explicitly encodes the assumption that our residuals are not normally distributed and most possibly exhibit heteroskedasticity (Wikipedia - Robust Regression).

So back square one. As some commenters have already noted: Are asking the correct question? I think you are not, at least not totally. If want to find if indeed some point really is "bluntly outlierish" and that "this is a good thing" then you might as well use a linear model, encode your normality assumptions by using lm() and then look at the outliers . Clearly those residuals will be strongly correlated with the Huber weights (regression$w) you are having here, and with robust residuals you are looking at right now also. I believe you need to work a bit on the formulation of your model. What exactly are you asking? Here is a brief explanation of how robust regression works against normal linear regression. Are you sure you want to use robust regression? Given the assumptions you are will to built in your model you can answer the question that stem from them, not the other way around. :)

$\endgroup$
7
  • $\begingroup$ Ok. So what you demonstrate goes into the direction I originally proposed to go into. The "rubbishness" of your approach is based on the fact that actually calculating the p-value from the residuals relies on normality. There are, however, other means to do that. I regularly use somthing called "significance A" by Cox and Mann (2008), which is a halfway robust equivalent to what you show above ("only" assuming normal tails). Would you consider a solution analogous to your but using that still "rubbish"? $\endgroup$
    – balin
    Commented Jun 17, 2013 at 13:22
  • $\begingroup$ And also: I prefer to stick with a continuous quantification of outlierishness to give experimentalists a ranking what to look at first and how risky it may be to go further with candidates ... $\endgroup$
    – balin
    Commented Jun 17, 2013 at 13:26
  • $\begingroup$ Hm... Sorry but yes, I believe it is still wrong; assuming normality in the tails is definitely not what you assume when you are using robust estimators. Usually using rlm() (and robust regression in general) alludes the fact that you theorize a mixture between normal and long-tailed errors. I don't see why "Significance A" should be use here. It is about log-ratio comparisons and I actually think this "percentile-based" approach is a bit ad-hoc and not easily generalizable in cases like yours. $\endgroup$
    – usεr11852
    Commented Jun 17, 2013 at 14:18
  • $\begingroup$ Just to get the ball rolling: Please consider presenting the QQ-plot if your original model. We could then see if there obvious outliers. Also thinking about the Cox & Mann paper now that I look it more carefully... You could use an approach as the one proposed by "Significance A" if you decide you don't care about your central moments too much. Also how big your sample? I mean, if you have a huge sample, get a non-parametric kernel density estimate that looks plausible and you compute $p$-values from that, nobody will really be able to reject them. $\endgroup$
    – usεr11852
    Commented Jun 17, 2013 at 14:46
  • $\begingroup$ Central moments = mean, std, curtosis, etc.? I don't think I care. Sample is usaually 300 to 5000 data points. Can you point me to an application of the density estimate approach you metnion? Also: thinking about the problem further: shouldn't the "significance boundary" at the points on the regression but farthest from the center of the data curve toward the line? Kind of the inverse of the slope-describing confidence interval? Will deliver a qq-plot day after tomorrow. $\endgroup$
    – balin
    Commented Jun 17, 2013 at 19:26

Your Answer

By clicking “Post Your Answer”, you agree to our terms of service and acknowledge you have read our privacy policy.

Not the answer you're looking for? Browse other questions tagged or ask your own question.