12
$\begingroup$

It is probably best if I give an example because I would like to be well-understood, and I do not know how to deal with the following situation:

I analysed, using the Kruskal-Wallis test (post hoc Dunn's test), three pairs of water quality measurements:

  • river VS wells row 1 (closer to the river)
  • river VS wells row 2 (further from the river)
  • wells row 1 vs wells row 2.

One of the objectives of the analyses was to indicate that, simplifying, the groundwater quality in wells row 1 is 'more similar' to the river water quality than the water in wells row 2 (the closer row 1 to the river, the better).

Thus, when comparing pairs of measurements, I expected that for a selected parameter, e.g. chloride, there would be statistically significant differences between the two wells rows and between the river and row 2. At the same time, there would be no statistically significant differences (in medians) between the river and row 1.

This is because such a result would allow me to conclude that the river significantly (or more significantly than in row B) influences row 1, and the riverbank filtration process functions better there etc. (the water is very similar)

So the lack of evidence to reject H0 is something I would expect. However, writing about it in the discussion, I cannot write that it is a statistically significant result, can I? Because rejection of H0 equates to p > 0.05 (the value I assumed), which is not a statistically significant result.

How should I describe it so as not to come across as a fool (I am doing a PhD in hydrogeology and learning statistics on my own, so please forgive me)?

edit:

deleted the new part based on the comment.

$\endgroup$
6
  • 1
    $\begingroup$ I don't think it's a good idea to include completely new questions in a subsequent edit (specially the question whether your chosen data visualization has nothing to do with the original post, which is rather unfortunate). The reason is simple: after your edit all answers provided so far that used to be appropriate responses to your original question are now only incomplete answers to your new list of questions. Your edit forces the responding authors to either revise and expand their answers or to accept that their answers may not receive further upvotes since they're incomplete. $\endgroup$
    – Schmuddi
    Commented Aug 22, 2023 at 15:22
  • $\begingroup$ Well, that is understandable, but how am I supposed to continue the discussion with the people who helped me? It seems, from what you said, I cannot edit my original question; before doing it, I posted the same part in the "add another answer" and immediately received the comment: "Please add this to your question. You can edit your post rather than using the answer field.". Feel free to edit my post and delete the new part but I wonder how I can continue the discussion now, since I cannot add screenshots in the "add the comment" section. $\endgroup$
    – crtnnn
    Commented Aug 22, 2023 at 15:29
  • $\begingroup$ And for the record: In my opinion, the plot is not ideal because it wastes the information the x axis could illustrate to show the uninformative "index" value of each observation. Perhaps you could try a strip chart (or a variant of that) instead? $\endgroup$
    – Schmuddi
    Commented Aug 22, 2023 at 15:30
  • 1
    $\begingroup$ "how am I supposed to continue the discussion with the people" – well, that's the thing: on most Stackexchange sites, an ongoing discussion is explicitly not desired. I'm really not familiar with how stats.stackexchange.com runs things, but the sister sites that I frequently visit all see themselves as adhering to a Q-and-A format in which posts consist of one question (or sometimes, a small number of questions), with answers in the form of self-contained responses. Most of these sites would advise you to write a new post for any question that results from a helpful answer to your first post. $\endgroup$
    – Schmuddi
    Commented Aug 22, 2023 at 15:35
  • 1
    $\begingroup$ I got you. Ok then. And thanks for suggesting the different plot type. $\endgroup$
    – crtnnn
    Commented Aug 22, 2023 at 15:41

4 Answers 4

8
$\begingroup$

You are correct that, in standard methods, you cannot accept the null. However, there is a set of methods called equivalence tests, that switches things around. You have to set a maximum difference that you think is not important. If you decide to go this route, there's lots of material online (including on here).

However, I'm not a huge fan of using significance as a measure of importance.

I have two possible ideas:

First: Regression, instead? It seems like you have several different measures of the water. One way to go would be to treat each one as a dependent variable and then look at location as an independent variable. Pairwise contrasts are then a reasonably common thing to do, but the parameter estimates themselves would be evidence for (or, maybe, against) your hypothesis.

Second, you might want to combine the different measures, maybe using factor analysis, to get overall measures of some sort of "qualities" of the water. I'm not sure if this makes sense in your particular case, it would depend on the particular measures and how they might fit together -- but you can probably figure that ought, based on subject matter expertise.

$\endgroup$
8
  • $\begingroup$ I do not understand everything in the answer regarding regression. Suppose I would like to run a linear regression for the chloride content of the test water. My three groups of data regarding this parameter are, let's call them, Cl_riv, Cl_row_1, Cl_row_2. Each group consists of two columns -> date and value. Number of observations differs between groups because there is a different frequency of river and well sampling and the number of wells in two rows is different. I don't know how I would take location as an independent variable - I don't understand what you mean. Can you please explain? $\endgroup$
    – crtnnn
    Commented Aug 22, 2023 at 9:45
  • $\begingroup$ You might have to rearrange your data. This happens a lot. You would want a row for each observation, with a location variable and all the other variables. Having different numbers of observations in different locations is not a problem. $\endgroup$
    – Peter Flom
    Commented Aug 22, 2023 at 10:01
  • $\begingroup$ Ok, but how do I make a location an independent variable since I have 3 locations (groups of samples from the river, row 1 and row 2) and like 60 observations of every parameter (let's stay with e.g. chlorides) in every group? It just cannot click in my head. Should I do, like, 3 different scatterplots in Excel - a) for river b) for row 1, and c) for row 2 and then, I don't know compare the "y" equations? Or did I completely misunderstand your point? I feel like I'm totally missing your point tbh, I'm sorry. $\endgroup$
    – crtnnn
    Commented Aug 22, 2023 at 10:54
  • 1
    $\begingroup$ Yes, that's right. $\endgroup$
    – Peter Flom
    Commented Aug 22, 2023 at 11:45
  • 2
    $\begingroup$ Re: Python vs. R: Python's statsmodels.formula.api library allows you to encode regressions almost exactly as in R, for example ols('chloride~location') (ols standing for 'ordinary least squares'). $\endgroup$
    – Igor F.
    Commented Aug 22, 2023 at 13:00
7
$\begingroup$

You could look at the problem from the perspective of power analysis. The problem with failing to reject a null hypothesis is that failure to reject by itself might indicate either that 1) you looked very thoroughly and didn't find sufficient evidence to support rejection, or 2) that you didn't look very hard at all and never bothered to collect evidence that would have allowed you to reject in any circumstance (or it could be somewhere between these two extremes). In the first case absence of evidence is indeed evidence of absence (one can reliably conclude they do not have an elephant in their garage upon looking and seeing no elephant), in the second case, it is not (one cannot conclude there is no elephant in their garage if they don't look at all).

You should describe the power of your experiment - given the amount of data you have and the effect sizes you're looking for, what is the likelihood that the effect would be deemed significant? If your experiment is appropriately powered, you have grounds to suggest that the lack of rejection of H0 does indeed suggest no effects of the given size. But if your experiment is underpowered, the lack of rejection says much more about the design of your experiment than the significance of the effect.

$\endgroup$
4
  • $\begingroup$ I understand your point of view. It seems to me that the data should "defend" itself in the article. I have measurements from a certified lab from 11 years from a site with stable hydrogeological conditions. I don't want to throw in specific numbers but assume I have about 50-60 observations for each parameter tested. I plan to include the raw data in the supplementary materials so that the reviewers can see the data I have analysed. Do you think it should be enough when I present this information clearly in the discussion? Or should I do any further analysis? $\endgroup$
    – crtnnn
    Commented Aug 22, 2023 at 9:55
  • $\begingroup$ @crtnnn It may not be clear what kinds of effect sizes you can reasonably expect to capture, unless you've got an overwhelming amount of data. You should run a proper power analysis, setting your desired type I and II error rates, and inputting the observed variability and meaningful effect size that you saw from the significant difference. This answers the question of what is the likelihood of incorrectly failing to rejecting the null when it is actually false. Basically, if there really was a difference as big as the other one, what's the probability you'd have deemed it significant? $\endgroup$ Commented Aug 22, 2023 at 13:14
  • $\begingroup$ Thank you for elaborating, but now I am even more puzzled, haha. I mean, I have never done the power analysis. Do I understand correctly that I should do it for the Kruskal-Wallis test? If yes, how do I know the values of the parameters you mentioned (I and II error rates, effect size etc.)? BTW. I didn't mention it in the OP, but before the Kruskal-Wallis, I did Levene’s test for equal variances and then conducted K-W for the groups statistically significant in Levene's - I don't know if that changes anything, but I thought I forgot to mention it before. $\endgroup$
    – crtnnn
    Commented Aug 22, 2023 at 14:02
  • $\begingroup$ @crtnnn This question may point you in the right direction: stats.stackexchange.com/questions/70643/…. Type I error rate is often 0.05, type II rate is often 0.2, and your effect size should be the effect size you saw in the significant comparison. $\endgroup$ Commented Aug 22, 2023 at 14:47
5
$\begingroup$

As an alternative to Peter Flom's excellent answer (+1), you may consider sticking to your tests, but formulating the discussion differently. Something along the lines:

No significant differences between the river water and well water from row 1 were found.

Admittedly, this is not as strong statement as showing that the difference is below some threshold, but it spares you the justification for the threshold (the "maximum difference that you think is not important" in Peter's answer). With some luck, you might quote values from the literature to justifiy it, but, if not, it might seem arbitrary.

$\endgroup$
1
  • $\begingroup$ Honestly, I would prefer to stay with the work already done, as I have the Methods and Results described and would like to focus on the Discussion now (time...). Therefore, your option is probably something I would stay with. This is the way I would like to describe it. I am currently doing a literature review and trying to look for similar examples, but some of the papers have no statistical tests at all just means, medians, SD and that's all if you know what I mean. The journal I want to publish the paper in focuses on hydrogeology and not strictly statistics so maybe would be enough.... $\endgroup$
    – crtnnn
    Commented Aug 22, 2023 at 10:03
2
$\begingroup$

This is because such a result would allow me to conclude that the river significantly (or more significantly than in row B) influences row 1, and the riverbank filtration process functions better there etc. (the water is very similar)

This motivation for your the expected outcomes of your tests is not very strong.

It sounds like you expect that the water in 'row 1' is closer to the water in 'river' than to the water in 'row 2'. But, you do not explain clearly why you can hypothesize that the distance between 'river' and 'row 1' is zero.

Your hypothesis should reflect what you expect. It is true that, with your expectations/hypothesis, you can argue why your tests reveal no significant differences for comparison 'river vs row 1' whereas 'river vs row 2' and 'row 1 vs row 2' are significantly different. However, it would not be so great to frame this as if it was your hypothesis all along. It sounds to me like you expected differences for all three comparisons, yet one of the differences is expected to be small. That leads to a smaller power in a direct comparison, and you have a higher probability that the observed difference will not be significant, but that is different from saying that you expect that the difference will not be significant (in other words you are saying that your experiment is not good enough to measure the difference that you wanted to test).

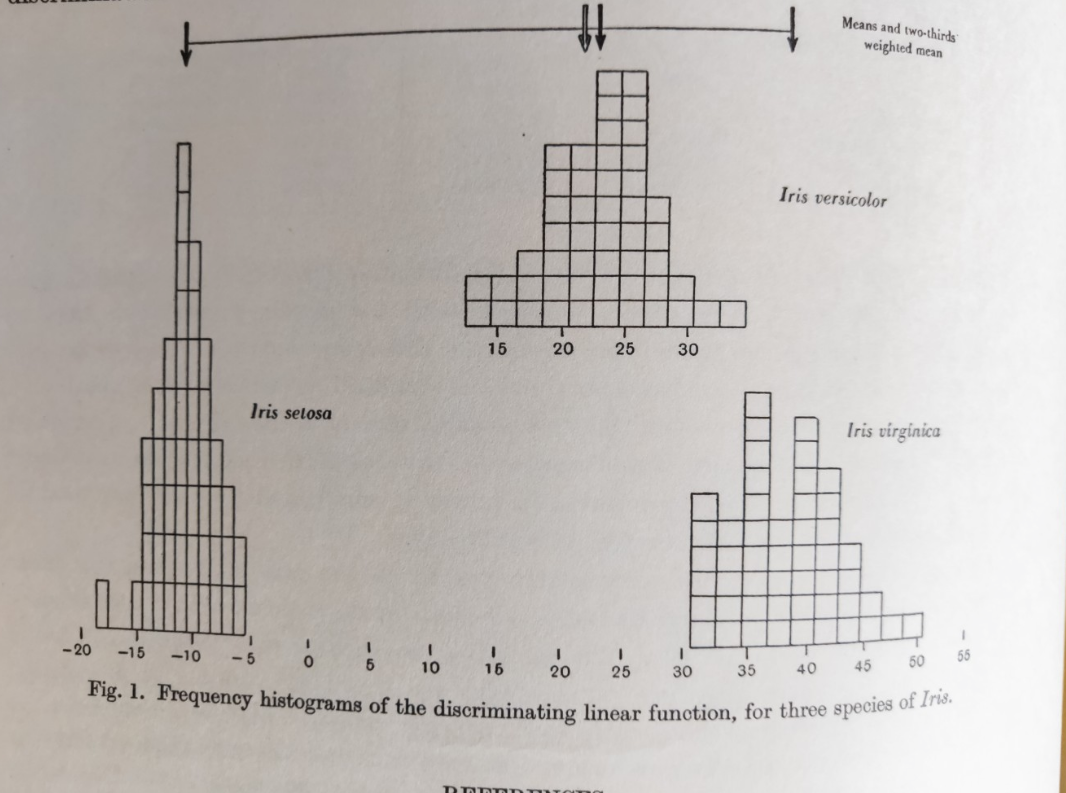
To do this differently you could mimic something like Fisher's research on the Iris flower data set, where he compared differences between three different species of flowers. In that case he used a linear discriminant analysis to express a scale based on which differences can be quantified.

"The use of multiple measurements in taxonomic problems" Annals of Eugenics, Vol VII, Pt. II, op. 179-188, 136

example of distribution for projection of iris data

If you could express a figure like that as well for your three water properties then potentially your idea that you want to explain in the article may come across better.

$\endgroup$

Your Answer

By clicking “Post Your Answer”, you agree to our terms of service and acknowledge you have read our privacy policy.

Not the answer you're looking for? Browse other questions tagged or ask your own question.