3
$\begingroup$

I have count data by group for which I would like to to model the outcome using a random effect for group. I was initially planning on using Poisson regression, but checked if the data are overdispersed to determine if a negative binomial distribution should be used.

Overall, the outcome data were indeed overdispersed, so was planning to go with NB. However, when assessing clusters individually, some of the clusters had within-cluster data were not overdispersed (ie, Poisson distributed).

Should I use the overall distribution of the data to determine between Poisson or NB GEE models, or are there alternative approaches when distribution differences by cluster are present?

I am using lme4::glmer and lme4::glmer.nb in R to implement this, for example:

Here are some sample data:

set.seed(123)
df <- data.frame(group = rep(LETTERS[1:4], each = 100),
                 arm = rep(c("Intervention", "Control"), each = 100),
                 ncount = c(rpois(100, lambda = 5), rpois(100, lambda = 5),
                            rnbinom(100, mu = 5, size = 0.50), rnbinom(100, mu = 5, size = 0.50)))

Here outcomes in groups A and B are Poisson distributed, and C and D are NB distributed.

par(mfrow = c(2,2))
sapply(unique(df$group), \(x) hist(df$ncount[df$group == x], main = paste0("Group ", x), xlab = "value"))
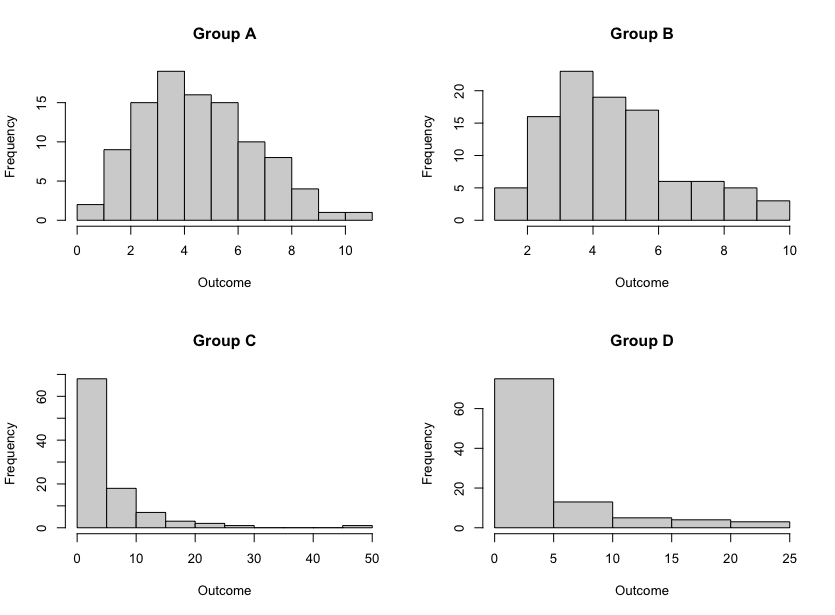
enter image description here And from the model information, it appears as if the NB approach is best:

poi <- lme4::glmer(ncount ~ arm + (1|group), data = df, family = "poisson")
nb <- lme4::glmer.nb(ncount ~ arm + (1|group), data = df)

data.frame(poi = summary(poi)$AICtab,
          nb = summary(nb)$AICtab)

#                poi        nb
# AIC       2787.536  2122.132
# BIC       2799.511  2138.098
# logLik   -1390.768 -1057.066
# deviance  2781.536  2114.132
# df.resid   397.000   396.000

In this example, which generally follows my real data, my plan would be to proceed with the negative binomial, but I am not sure if there are more accurate methods that account for this phenomenon.

$\endgroup$

1 Answer 1

2
$\begingroup$

If the example data is representative of your real data, it's not sufficient to choose the negative binomial regression over the Poisson regression. One issue is that the NB GLMM implemented by lme4::glmer.nb has one dispersion parameter. Groups A & B and Groups C & D have different dispersions, so lme4::glmer.nb would estimate the overall dispersion to be somewhere in-between; the end result would be that the model doesn't fit any group well.

One solution is to estimate a different dispersion parameter for each group. I show how to do such analysis using the brms package. So this is a Bayesian solution.

First let's fit a negative binomial model with a single dispersion parameter, which is shared by all groups.

fita <- brm(
  bf(
    ncount ~ arm + (1 | group)
  ),
  family = negbinomial,
  data = df
)

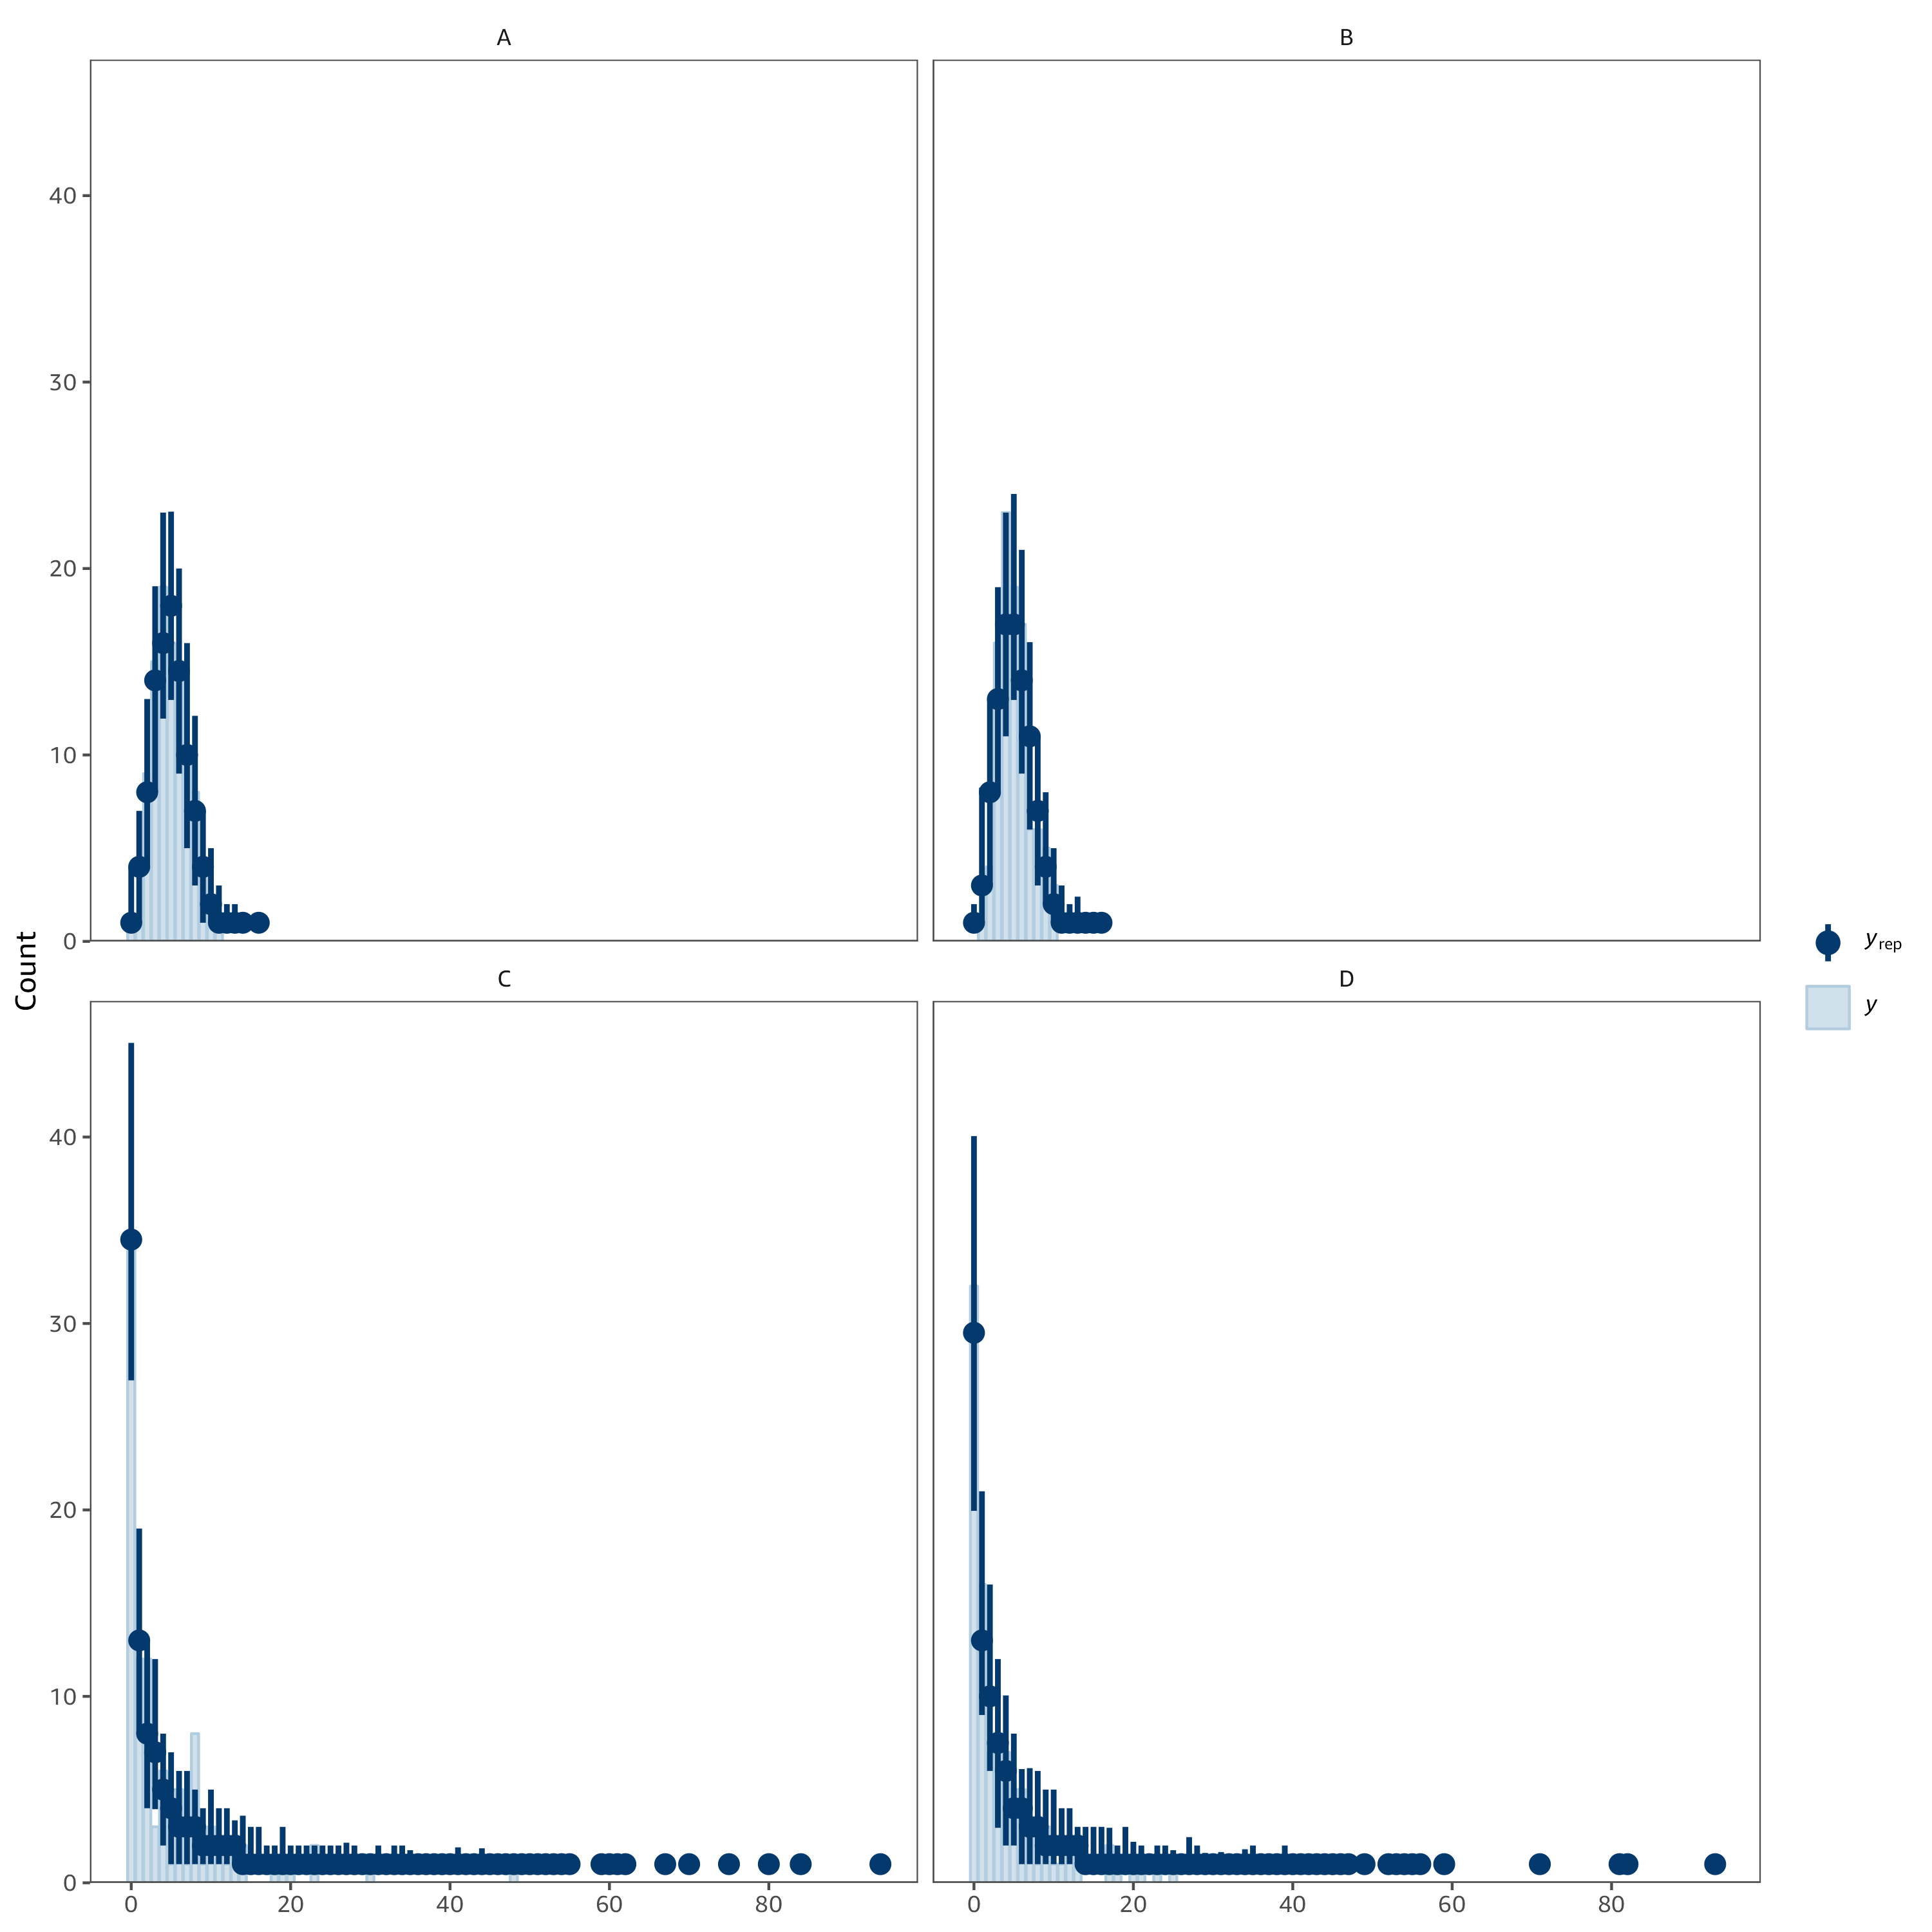
How good is the fit? A posterior predictive check (PPC) warns us it's not very good at all:

enter image description here

Keep in mind that the issue is not that this is a Bayesian model but that all four groups share the same shape (inverse overdispersion) parameter.

Next let's fit a negative binomial model with a shape parameter for each group:

fitb <- brm(
  bf(
    ncount ~ arm + (1 | group),
    shape ~ group
  ),
  family = negbinomial,
  data = df
)

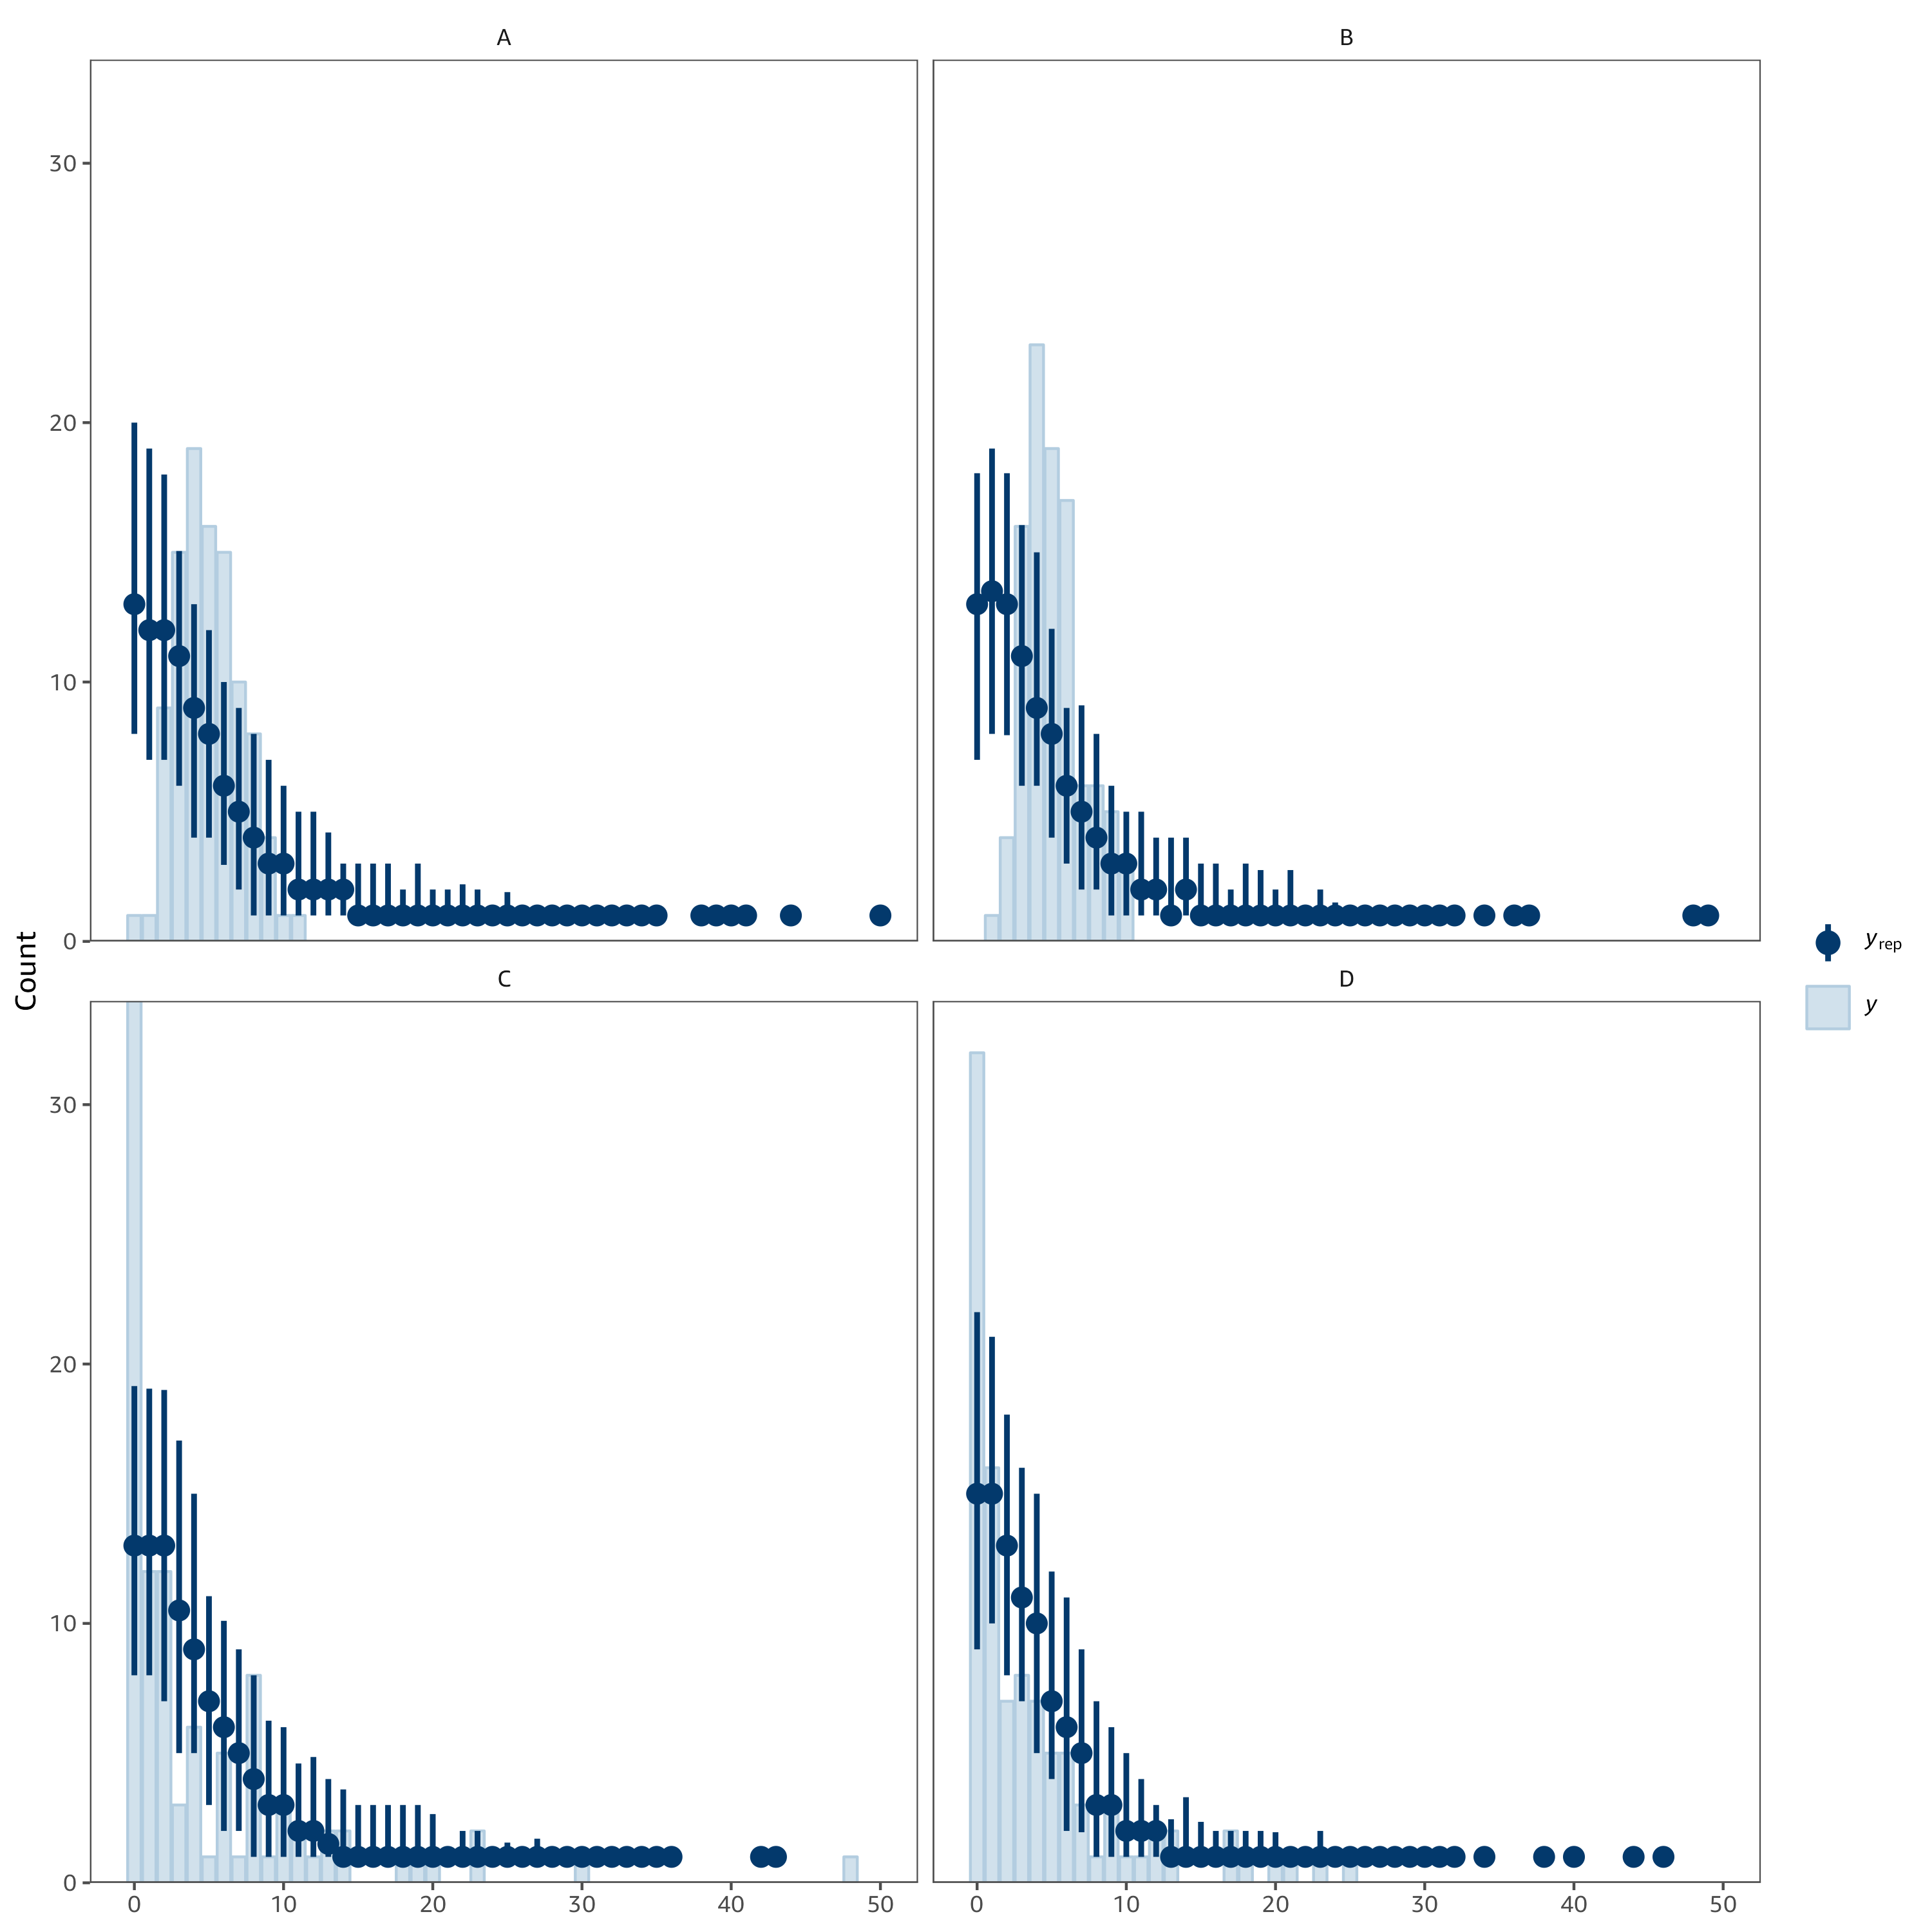
How good is this fit? The posterior predictive check doesn't raise obvious concerns:

enter image description here

NB: I used the default brms priors. It's a start but there were warnings about divergent transitions and large R-hats (diagnostics which indicate issues in the model or in the estimation). So more work is required to make the Bayesian approach work well.

$\endgroup$
3
  • 1
    $\begingroup$ Thank you! I'll look into the brms package and see if that approach is a good fit $\endgroup$
    – jpsmith
    Commented Sep 9, 2023 at 11:45
  • $\begingroup$ For completeness, I was wondering what the non-Bayesian solution would be. A comment by @ThomasLumley to this post suggests that the VGAM package can fit this model (by MLE). $\endgroup$
    – dipetkov
    Commented Sep 10, 2023 at 9:13
  • $\begingroup$ Though if there are many groups, MLE may be have problems of its own. The Bayesian approach offers: shrinking the shape parameter estimates to 1 (by using an appropriate prior) or pooling them in a hierarchial model (with a shape hyperparameter). $\endgroup$
    – dipetkov
    Commented Sep 10, 2023 at 9:32

Your Answer

By clicking “Post Your Answer”, you agree to our terms of service and acknowledge you have read our privacy policy.

Not the answer you're looking for? Browse other questions tagged or ask your own question.