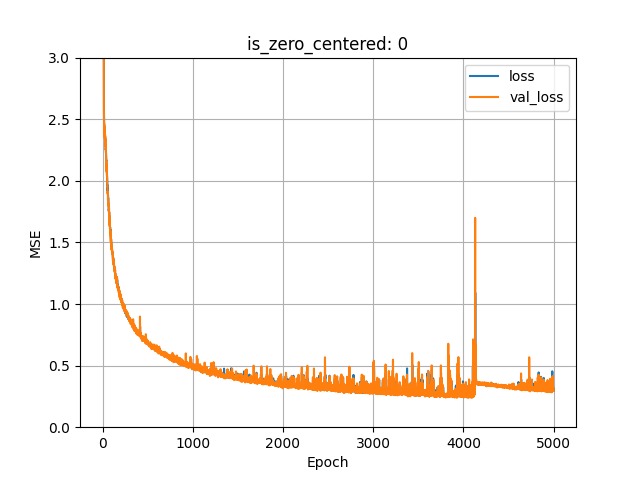
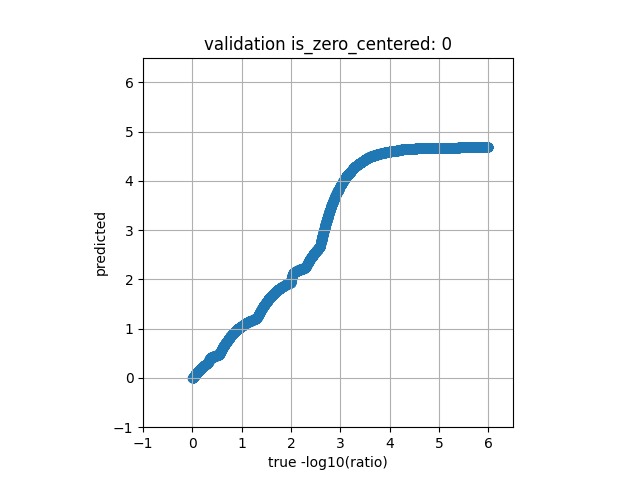
I've lately ran into an interesting problem, trying to teach a dense network a seemingly simple monotonous function- to regress a logarithmic function;
When this function was centered around 0 it seemed to be able to find decent solutions converging at ~0 error, but if this target function was shifted horizontally, the network doesn't seem to find a solution and after an initial learning phase converges to a high error level (so it doesn't seem to be just an input normalization (i.e. zero mean) issue per se, which is expected to slow down convergence but not prevent it altogether)
Below is a minimal code example to reproduce the problem, with the variable is_zero_centered controlling the two running regimes. attached are also images of results with the two states of this variable and their learning curves (which sometimes jump but this seems unrelated) 


 .
.
Any insights or solutions will be greatly appreciated!!
PS The real problem this is a schema of is more complex and prohibits simply shifting the inputs to around 0- so the challenge is finding a solution with the training procedure or model itself
import numpy as np
import tensorflow as tf
import matplotlib.pyplot as plt

ratio_min_log10 = -6
ratio_max_log10 = 0

model_fcn_width = 16#64
model_fcn_layers = 2

TRAIN_BATCH_SIZE = 8192

numepochs = 5000

is_zero_centered = 1 #0

def make_toy(sizer,ratiorange):
    rati_log = ratiorange[0]+np.random.rand(sizer)*np.diff(ratiorange)[0]
    rati = 10**rati_log
    rati.shape=(sizer,1,1)

    # input transformation-
    batchy =  (1*(1-is_zero_centered)-rati)*0.7

    da_ds_y = -rati_log
    da_ds_x = batchy

    return((da_ds_x,da_ds_y))

class toysynth(tf.keras.utils.Sequence):
    def __init__(self, batch_size,lenny,interi=(ratio_min_log10,ratio_max_log10)):
        self.batch_size = batch_size
        self.lenny = lenny
        self.interi = interi

    def __len__(self):
        return self.lenny//self.batch_size

    def __getitem__(self, idx):
        return make_toy(self.batch_size,self.interi)

def plot_loss(history_orig,n=0,titlee=''):

    histi = history_orig

    plt.plot(histi['loss'][n:], label='loss')
    plt.plot(histi['val_loss'][n:], label='val_loss')
    #plt.ylim([0, 1])
    plt.xlabel('Epoch')
    plt.ylabel('MSE')
    plt.legend()
    plt.title(titlee)
    plt.grid(True)

def main():
    # model definition:
    inputs = tf.keras.Input((1, 1))
    x = tf.keras.layers.Flatten(name='flatten')(inputs)
    for ii in range(model_fcn_layers):
        x = tf.keras.layers.Dense(model_fcn_width,activation='relu')(x)
    outputs = tf.keras.layers.Dense(1, activation='linear')(x)

    model = tf.keras.Model(inputs, outputs)

    model.compile(
        optimizer=tf.keras.optimizers.Adam(learning_rate=4e-3),
        loss='mse',
        metrics=tf.keras.metrics.MeanSquaredError())

    train_generator = toysynth(TRAIN_BATCH_SIZE,TRAIN_BATCH_SIZE*4)
    test_generator = toysynth(TRAIN_BATCH_SIZE,TRAIN_BATCH_SIZE)

    histi = model.fit(train_generator, epochs=numepochs,validation_data=test_generator,verbose=1)

    test_generator = toysynth(TRAIN_BATCH_SIZE,TRAIN_BATCH_SIZE)

    yyy=[]
    zib=[]

    for batch_now in test_generator:

        zib_batch=model.predict(batch_now[0],batch_size=TRAIN_BATCH_SIZE);

        [yyy.append(yyyy) for yyyy in batch_now[1]]
        [zib.append(ziby) for ziby in zib_batch]

    #plt.figure()
    plt.scatter(yyy,zib)
    plt.axis('square')
    plt.xlim(-1, 6.5)
    plt.ylim(-1, 6.5)
    plt.xlabel('true -log10(ratio)')
    plt.ylabel('predicted')
    plt.title('validation is_zero_centered: ' + str(is_zero_centered))
    plt.grid()
    plt.savefig('toyfig7' +str(is_zero_centered) +'.png')
    plt.close()

    plt.figure()
    plot_loss(histi.history)
    plt.ylim(0, 3)
    plt.title('is_zero_centered: ' + str(is_zero_centered))
    plt.savefig('toyfig6'+str(is_zero_centered)+'.png')
    plt.close()

if __name__ == '__main__':
    main()
