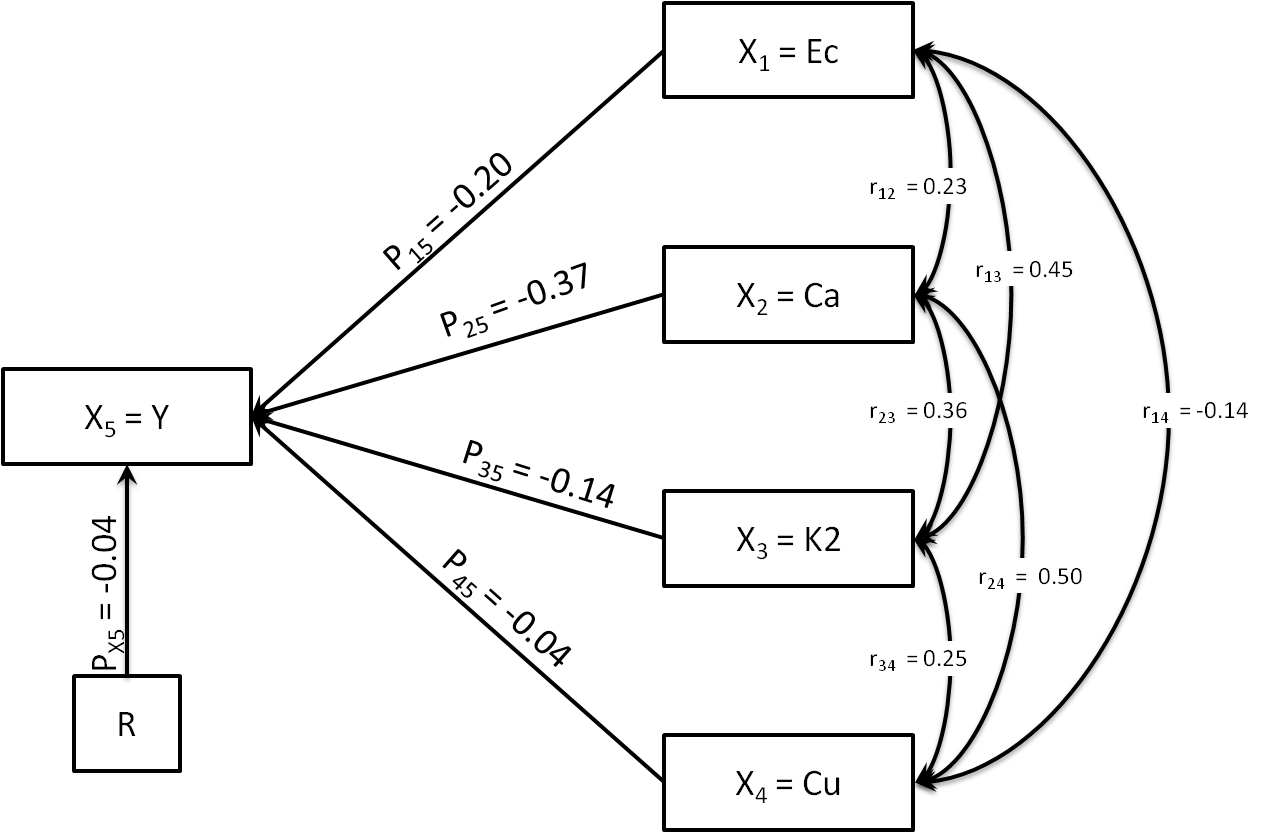
DAGs are used for much more than visualization
Expressing the (causal) relationships between variables as DAGs allows employing graphical criteria for finding answers to statistical or causal questions.
Example: checking the validity of an adjustment set
Certainly one of the most prominent use-cases is that of finding valid adjustment sets. The DAG formulation allows one to check the suitability of an adjustment set when estimating the effect of $X_s \to X_t$ (source $s$ to target $t$) given variables $X = (X_1,\dots,X_d)$ and a candidate adjustment set $X_A \subset X$.
Let $B_\mathcal{G}$ be the binary adjacency matrix of a graph $\mathcal{G}$ encoding the existence of causal edges between the elements of $X$.
$\left(B_\mathcal{G}\right)_{i,j} = 1$ if an edge from $X_i$ to $X_j$ exists in $\mathcal{G}$ and $0$ otherwise.
We can now use this representation to make sure that
1. No controlling for colliders. No $X_j \in X_A$ should be a descendant of $X_s$.
Using a graphical criterion, we can check if $\left(\sum_{i=1}^d B_\mathcal{G}^i\right)_{s,j}=0$ for all $X_j\in X_A$.
2. No open backdoor paths. After removing all edges connected to any $X_j\in X_A$ as well as outgoing edges from $X_s$, there should be no more nodes from which there is a directed path to $X_s$ and to $X_t$.
Let $\bar{B}_\mathcal{G}$ be a version of $B_\mathcal{G}$ with all incoming and outgoing edges to nodes $X_j \in X_A$, and all outgoing edges from $X_s$ removed.
Let further $\boldsymbol{\bar{B}} =\left(\sum_{i=1}^{d}\bar{B}_\mathcal{G}^i\right)$. We can now check if $\boldsymbol{\bar{B}}_{j,s}\boldsymbol{\bar{B}}_{j,t}=0$ for all $j \in 1,\dots d$.
(There may be valid adjustment sets that don't pass this test, but any adjustment passing it is valid.)
Summary
DAGs are absolutely used for computations and are by no means only a tool for visualization.

