1
$\begingroup$

I have the following data:

## # A tibble: 525 × 8
##    Subject Group Type    ISI Label  MeanEMG MeanRRA MeanRRA2
##    <fct>   <fct> <fct> <dbl> <fct>    <dbl>   <dbl>    <dbl>
##  1 17      HC    BL        0 HC BL     41.4    1        1.28
##  2 17      HC    BL        4 HC BL     67.8    1.64     2.09
##  3 17      HC    BL        5 HC BL     51.3    1.24     1.58
##  4 17      HC    BL        8 HC BL     56.0    1.35     1.73
##  5 17      HC    BL       10 HC BL     79.7    1.93     2.46
##  6 17      HC    BL       15 HC BL    104.     2.51     3.21
##  7 17      HC    BL       20 HC BL    129.     3.13     3.99
##  8 17      HC    SWD       0 HC SWD    93.9    1        1.20
##  9 17      HC    SWD       4 HC SWD   107.     1.14     1.36
## 10 17      HC    SWD       5 HC SWD   142.     1.51     1.81
## # ℹ 515 more rows

I am attaching a summary plot of the variable of interest, MeanEMG, across distinct ISIs. On each plot, we separately show the distribution of MeanEMG for the two different levels of Group and Type. enter image description here
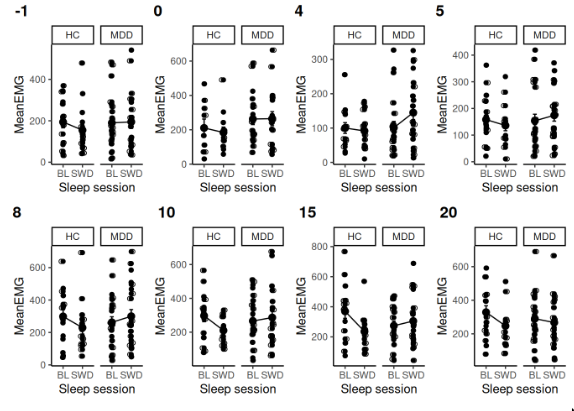
I am interested in the effects of Group and Type on MeanEMG. I expect the overall distribution of MeanEMG to differ across ISI levels. In particular, I expect that MeanEMG is higher for higher values of ISI.

I am having trouble defining what the correct model would be. We have a random effect in Subject, evidently. But is ISI a random effect as well or a fixed one? Each Subject is exposed to the same number and same levels of ISI. In particular, ISI and Type are within subject categories, while Group is a between subject category.

Simple models, such as lmer(MeanEMG ~ Group * Type + (1|Subject) + (1|ISI), pdf) don't fit the model very well. What formula would be sensible to explore the effects I have described?

EDIT: Meaning of the variables and description of experiment.

Descritpion: Healthy controls and MDDs (Depressed) were subjected to two types of sleep sessions, BL (Baseline) and SWD (Sleep deprivation). After each session, brain stimulations were given to them and their responses were measured using EMG (electromyography). Some, but not all stimulations were paired with another. In paired stimulations, a second stimulation was given $x$ miliseconds after the first. The value of $x$ is called ISI (inter-stimulus interval).

So, the variables are

  • Group: Factor with Healthy Control or MDD (Depressive)

  • Type: Type of Sleep Session underwent prior to the experiment. Can be Baseline or SWD (Sleep deprivation).

  • MeanEMG: Average response to brain stimulations as measured by electromyography.

  • ISI: The interstimulus interval used in paired stimulations. Unpaired stimulations (a unique stimulation given) is represented by 0.

So, we could "read" the second row as follows to illustrate:

In Subject 17, a healthy control, after baseline (normal) sleep, the average response to those brain stimulations consisting of two paired-pulses separated by $4$ miliseconds, as measured by the electromyography, was $67.8$

$\endgroup$
5
  • 1
    $\begingroup$ ISI would be fixed, probably. If you think MeanEMG responds to ISI linearly (or some other relationship), include it as a fixed term. Using it as a random effect, as you have in the final paragraph of your question, is treating it as a discrete variable. Which doesn't sound like it reflects your understanding of the scenario. $\endgroup$
    – Alex J
    Commented Dec 1, 2023 at 3:59
  • 2
    $\begingroup$ It would be really helpful if you could explain what all of your variables mean, otherwise it is difficult to say for certain what model works here. $\endgroup$ Commented Dec 1, 2023 at 11:13
  • $\begingroup$ Your tibble shows ISI to be a numeric variable while random effects need to be categorical. Perhaps the software automatically makes that conversion, but it's safest to do that conversion yourself. Please edit the question to describe what your variables mean, as @ShawnHemelstrand has asked, and to state the hypothesis about them that you want to test. Provide that information by editing the question itself, as comments are easy to overlook and can be deleted. $\endgroup$
    – EdM
    Commented Dec 1, 2023 at 16:30
  • $\begingroup$ I have cleaned and formatted the data so it is clearer, as well as included further explanation on the experiment in question and the meaning of the variables. Thank you all for taking the time to comment. $\endgroup$
    – lafinur
    Commented Dec 1, 2023 at 19:16
  • $\begingroup$ Thanks for adding that information. One follow-up: if unpaired stimulations take an ISI value of 0, what does the ISI value of -1 in your plot represent? $\endgroup$
    – EdM
    Commented Dec 2, 2023 at 19:52

1 Answer 1

0
$\begingroup$

As ISI is a variable that's under experimental control, it should be included at least as a fixed effect in the model.* With a potentially continuous variable like ISI, you typically want to fit it flexibly, for example with a regression spline or other generalized additive model. That would account for baseline changes in MeanEMG associated with ISI.

With the ns() function in the R splines package, the model then might have the general form:

lmer(MeanEMG ~ Group * Type + ns(ISI,..) + (1|Subject))

where you choose the other arguments to ns() to provide the fitting flexibility you desire.

It's not completely clear how to handle the ISI values of $0$ and $-1$. It's not clear what the value of $-1$ represents. If the value of $0$ represents an unpaired stimulus, you should include an additional predictor indicating whether there was a paired stimulus. That would allow for a difference between the estimated MeanEMG without a paired stimulus and the extrapolated/interpolated estimate with 0 time between paired stimuli. This answer illustrates that approach to evaluating a continuous predictor that by definition can't have an actual value for some cases.

You might need to go even farther. If you think that ISI also influences the effects of Group, Type, or their combination, then you would need to include corresponding interaction terms. That can get tricky with a flexibly fit predictor like above for ISI. Frank Harrell discusses those issues and some useful compromises in Chapter 2 of Regression Modeling Strategies.


*In principle one might then include ISI also as a random slope in the model, to allow for differences in the association between ISI and MeanEMG among individuals. But the simple form of +(ISI|ID) would assume a linear association between ISI and EMG, and evaluating random slopes typically takes a lot of observations.

$\endgroup$

Your Answer

By clicking “Post Your Answer”, you agree to our terms of service and acknowledge you have read our privacy policy.

Not the answer you're looking for? Browse other questions tagged or ask your own question.