1
$\begingroup$

I am trying to replicate a study published by Bai & Liang, 2022 which focuses on clustering purely categorical data which are mostly found in the UCI repository. In my experiment for K-Modes, I have observed that the indices which includes the Normalized Variation of information (NVI), Normalized Information Distance (NDI), Normalized Mutual Information (NMI), Adjusted Mutual Information (AMI), and Adjusted Rand Index (ARI) are no better than random labelling, upon checking with the published paper, the values for NMI and ARI that were reported by the authors where are all above 0.5. However, the Folkes-Mallows Index seems to show relatively good values.

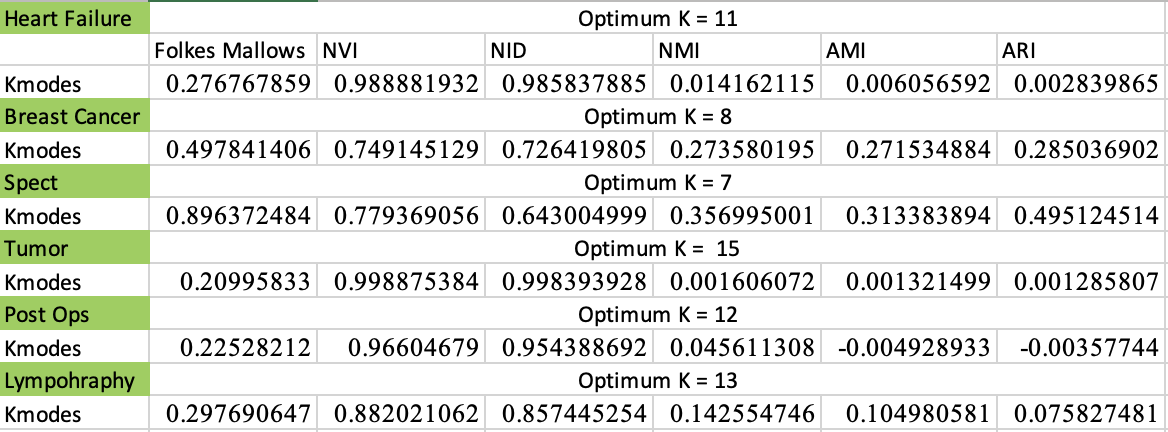
I wanted to know why is this happening, that is I am trying to investigate this observable deviation. My first suspicion is that the number of optimal clusters is just too high, which makes comparing between the original cluster label (ranging between 2 clusters to 4 clusters) and the generated clusters labels too difficult. For context I ran K-Modes 100 times and I averaged the values of the indices which is reported in this table:

enter image description here

Given the reported values, I am wondering if NVI, NID, NMI, AMI and ARI are really a good measures for categorical data clustering, or should I use measures of internal consistency, like running a Latent Class Analysis on each cluster to check for internal consistency as an alternative measure for clustering performance. Furthermore, I am also wondering if Chi-Square distance might also be a good alternative.

$\endgroup$

1 Answer 1

0
$\begingroup$

Rand index and variation of information can both be decomposed into two components, although for Rand index one needs to work with the complement (Mirkin distance). Rand index is a similarity, and variation of information is a distance, so it is worthwhile being absolute clear on these things. Perhaps the other measures can be decomposed too (after, if necessary, converting to distance). If c1 and c2 are clusterings (one might be an external labeling or classification), then VI(c1, c2) = VI(c1, G) + VI(c2, G), where VI denotes variation of information and G is the greatest common subclustering of c1 and c2. If c1 is to some extent a sub-clustering of c2 or vice versa, then this decomposition will show the size of the extent. As an aside, I do not rate the adjusted Rand index or other adjusted indices - the space of partitions is a nice mathematical object where we can use metric distances. There is no point in adjusting for chance; one would similarly not adjust the distance or similarity between London and Paris for chance. See also this answer for a longer discussion of the subject. In particular, the Rand index is heavily affected by cluster sizes in a quadratic manner; it can give completely counterintuitive answers when large clusters are compared with small clusters - see the linked answer for examples.

$\endgroup$

Your Answer

By clicking “Post Your Answer”, you agree to our terms of service and acknowledge you have read our privacy policy.

Not the answer you're looking for? Browse other questions tagged or ask your own question.