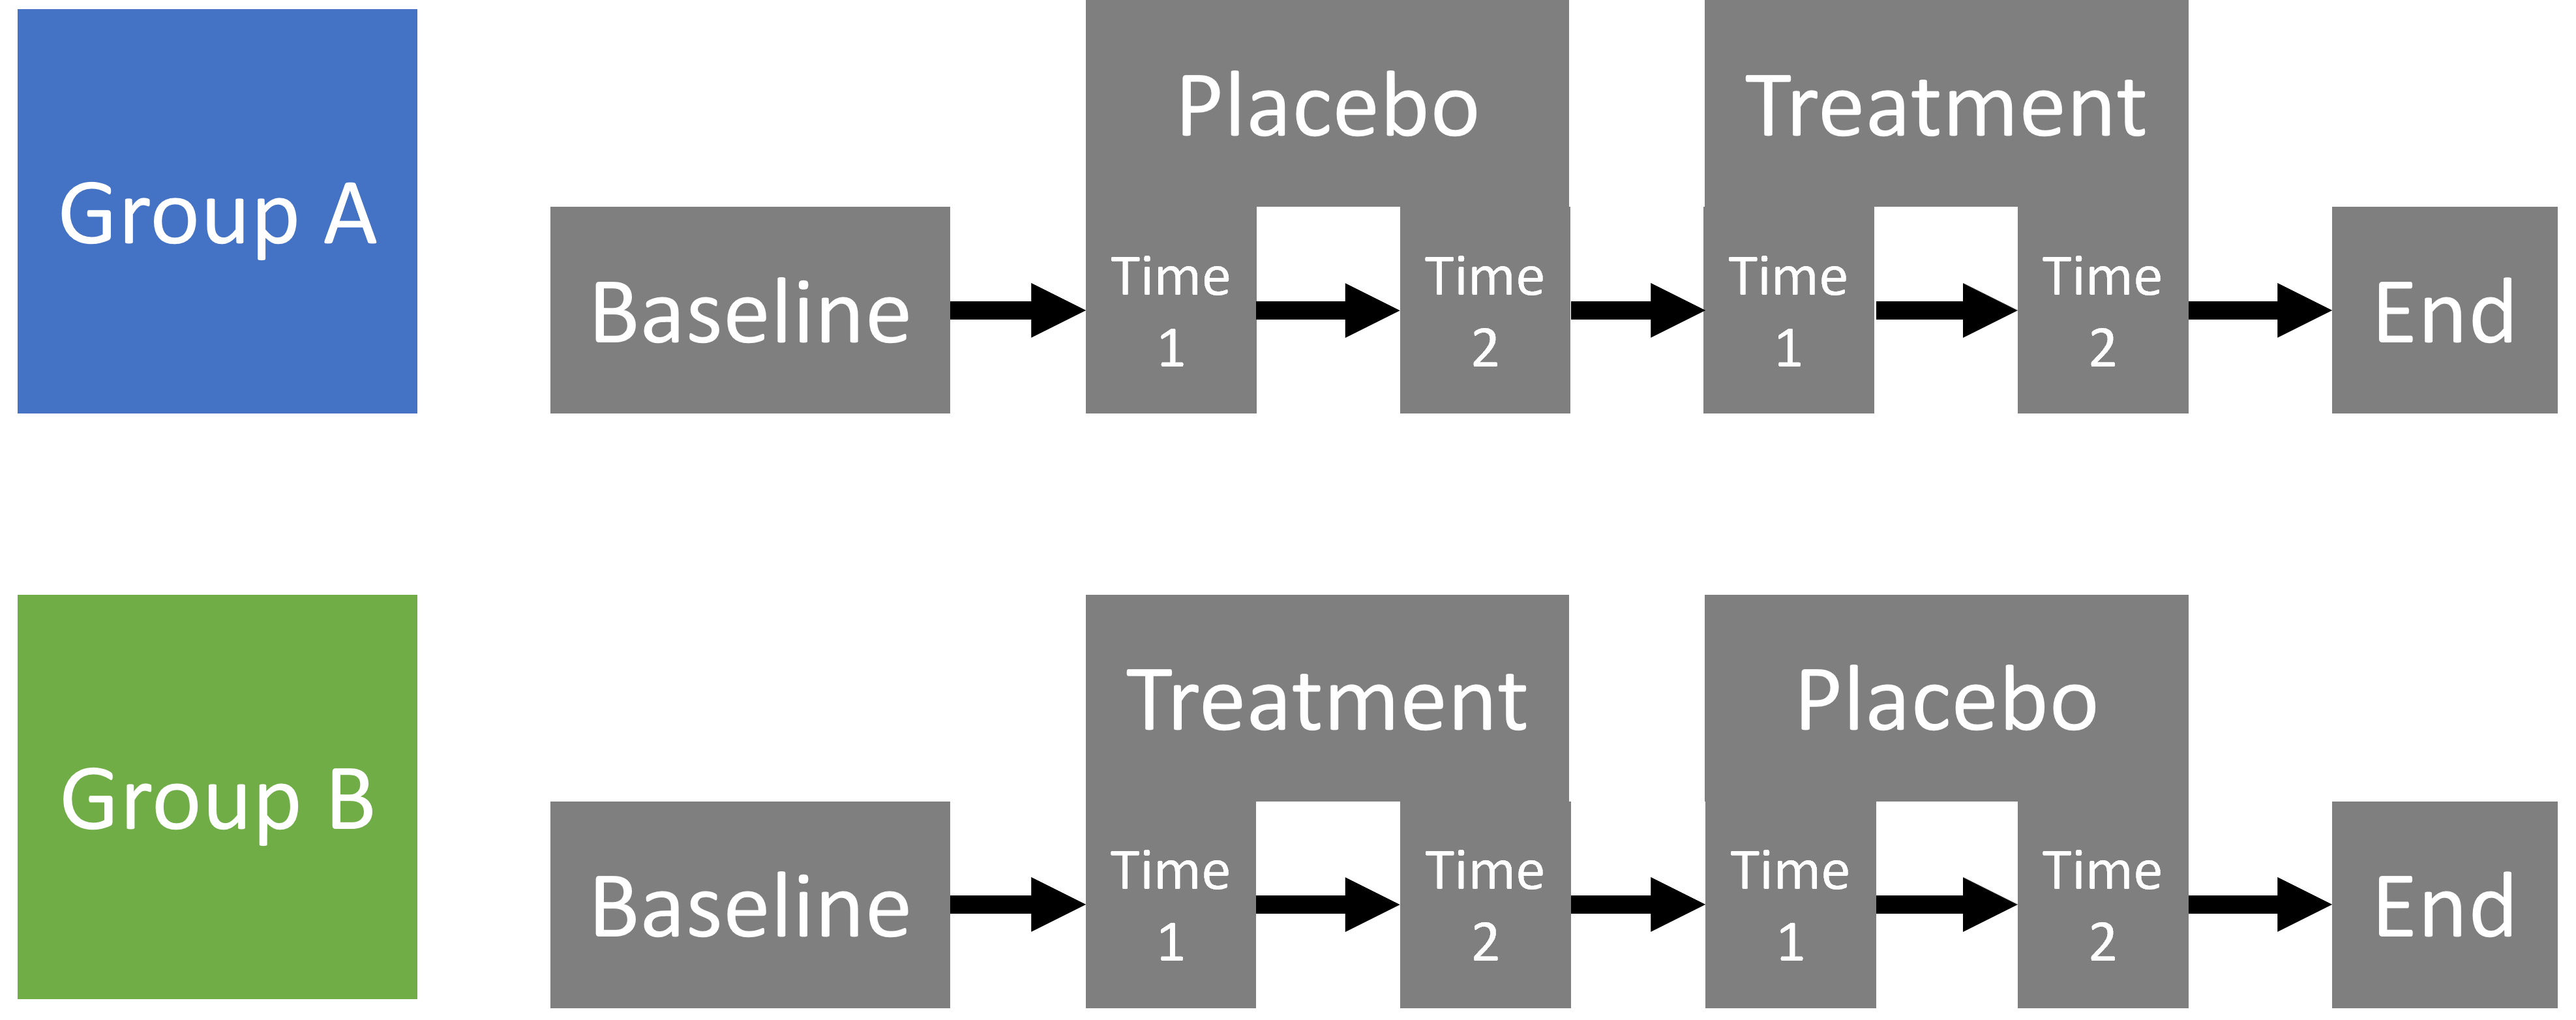
I'm analyzing a crossover study, where subjects are measured at two time points during each treatment phase (Placebo or Treatment). Additionally, baseline measurements were taken before the experiment began and also post-experiment. The orders of treatments were changed. See bellow the design schema.
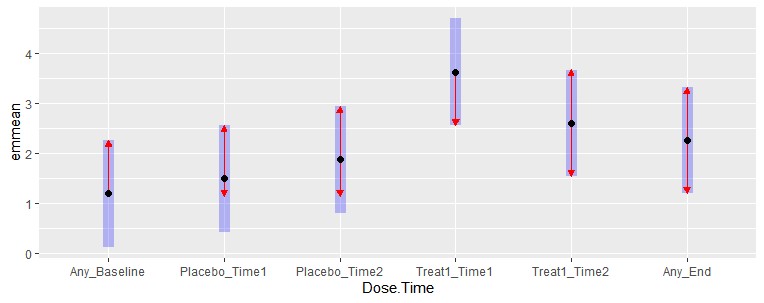
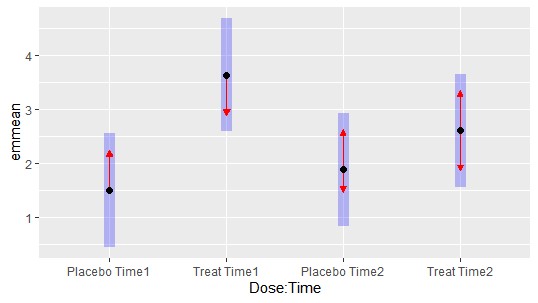
The primary objective is to test the effects of treatments and time. I have fitted two mixed models. The first one includes a variable that combines Treatment and Time with six levels, reflecting the unbalanced nature of the data. The second model omits the beginning and end measurements, focusing solely on treatment phase data.
Questions:
1) Can the first model, despite its unbalance, estimate the main effects of treatment and time?
2) How crucial is it to account for carryover and order effects in such experiments, and what would be the best approach to analyze these?
# Required Libraries
library(lme4)
library(emmeans)
library(car)

# Data Loading
DATA <- structure(list(ID = structure(c(1L, 1L, 1L, 1L, 1L, 1L, 2L, 2L,
    2L, 2L, 2L, 2L, 3L, 3L, 3L, 3L, 3L, 3L, 4L, 4L, 4L, 4L, 4L, 4L
    ), .Label = c("Sub1", "Sub2", "Sub3", "Sub4"), class = "factor"),
    Dose = structure(c(1L, 2L, 2L, 3L, 3L, 1L, 1L, 2L, 2L, 3L,
    3L, 1L, 1L, 3L, 3L, 2L, 2L, 1L, 1L, 3L, 3L, 2L, 2L, 1L), .Label = c("Any",
    "Placebo", "Treat"), class = "factor"), Group = structure(c(1L,
    1L, 1L, 1L, 1L, 1L, 1L, 1L, 1L, 1L, 1L, 1L, 2L, 2L, 2L, 2L,
    2L, 2L, 2L, 2L, 2L, 2L, 2L, 2L), .Label = c("A", "B"), class = "factor"),
    Order = structure(c(1L, 2L, 2L, 3L, 3L, 4L, 1L, 2L, 2L, 3L,
    3L, 4L, 1L, 2L, 2L, 3L, 3L, 4L, 1L, 2L, 2L, 3L, 3L, 4L), .Label = c("0",
    "1", "2", "3"), class = "factor"), Time = structure(c(1L,
    3L, 4L, 3L, 4L, 2L, 1L, 3L, 4L, 3L, 4L, 2L, 1L, 3L, 4L, 3L,
    4L, 2L, 1L, 3L, 4L, 3L, 4L, 2L), .Label = c("Baseline", "End",
    "Time1", "Time2"), class = "factor"), Dose.Time = structure(c(1L,
    2L, 3L, 4L, 5L, 6L, 1L, 2L, 3L, 4L, 5L, 6L, 1L, 4L, 5L, 2L,
    3L, 6L, 1L, 4L, 5L, 2L, 3L, 6L), .Label = c("Any_Baseline",
    "Placebo_Time1", "Placebo_Time2", "Treat1_Time1", "Treat1_Time2",
    "Any_End"), class = "factor"), Var1 = c(1.3, -0.87, 1.13,
    2.61, 2.21, 2.41, 0.47, 1.82, 1.5, 4.55, 2.2, 1.92, 0.95,
    3.67, 3.22, 2.5, 2.1, 0.56, 2.08, 3.68, 2.78, 2.54, 2.78,
    4.16), Var2 = c(1.74, 0.78, 0.7, 1.93, 1.83, 1.72, -1.07,
    2.09, 1.75, 2.68, 1.07, 3.56, 2.13, 0.89, 1.27, 1.13, 1.2,
    2.69, 2.94, 3.53, 2.87, 3.63, 1.54, 3.33)), row.names = c(NA,
    -24L), class = "data.frame")

str(DATA)

# Model 1: Including All Data Points
LMER <- lmer(Var1 ~ Dose.Time + Group + (1|ID), data = DATA)
Anova(LMER)
EMM <- emmeans(LMER, ~Dose.Time, type = "response")
plot(EMM, comparisons = TRUE, horizontal = FALSE)

# Model 2: Excluding Baseline and End Measurements
DATA1 <- DATA[!DATA$Dose.Time %in% c("Any_Baseline", "Any_End"),]
DATA1$Dose.Time = factor(DATA1$Dose.Time)
LMER <- lmer(Var1 ~ Dose * Time + Dose * Group + (1|ID), data = DATA1)
Anova(LMER)
EMM <- emmeans(LMER, ~Dose * Time, type = "response")
plot(EMM, comparisons = TRUE, horizontal = FALSE)


